Introduction
Many professionals begin their careers as MIS executives, handling reports, maintaining spreadsheets, and supporting management with important business data.
In recent years, many MIS professionals have started exploring the MIS to data analyst career path as companies increasingly rely on data-driven decision-making.
The good news is that MIS executives already work closely with business data, which makes the transition into a data analytics role much easier than many people think.
Over time, however, a common question starts to appear in their minds: Is there a way to grow beyond routine reporting work?
Fortunately, the answer is yes.
Instead of simply collecting numbers, companies now want professionals who can interpret data, identify patterns, and provide insights that help improve business performance.
This is where the role of data analytics becomes truly important.
Interestingly, MIS executives already work with business data every day.
They understand:
- How reports are generated
- How operational metrics are tracked
- How departments rely on accurate information
This is why many professionals today explore the MIS to Data Analyst transition as a natural step for career growth.
The transition from MIS executive to data analyst does not always require changing companies or starting from scratch.
Today, organizations across industries rely heavily on data-driven decision-making, and the demand for data analytics skills continues to grow across multiple sectors.
Many professionals successfully transform their roles by gradually expanding their responsibilities, learning analytical tools, and demonstrating the value of deeper data insights.
If you are currently working as an MIS executive and wondering how to move toward a more analytical career path, this guide will show you practical strategies that can help you upgrade your role inside your existing organization.
If you are new to analytics, you can also explore our detailed guide on Data Analyst Roadmap for Beginners to understand the complete learning path.
Can an MIS Executive Become a Data Analyst?
Yes. MIS executives already work with business data through reporting, dashboards, and performance tracking. By learning tools like SQL, Power BI, and analytical thinking, many MIS professionals successfully transition into data analytics roles without changing companies.
How MIS Professionals Can Transition from MIS to Data Analyst
Many MIS professionals eventually explore the MIS to Data Analyst career path as organizations begin relying more heavily on data-driven insights.
By gradually improving analytical skills and learning modern tools, this transition can often happen within the same company. With the right tools and mindset, the transition from MIS to Data Analyst can happen gradually without changing companies.
Why MIS Executives Are Naturally Close to Data Analytics
Before exploring the transition steps, it is important to understand why MIS professionals already have an advantage when entering the analytics field.
Many people believe that data analysts and MIS executives perform completely different jobs.
In reality, both roles revolve around business data. The difference lies mainly in how that data is used.
An MIS executive typically focuses on collecting, organizing, and reporting information.
For example, they may prepare:
- Daily sales reports
- Inventory updates
- Performance dashboards for management.
A data analyst takes this process one step further.
Instead of only presenting numbers, they examine the data carefully to uncover insights such as trends, patterns, and business opportunities.
Because MIS executives already spend a large portion of their time working with datasets, they already possess several valuable skills that are essential for analytics.
These include:
- Experience working with large Excel datasets
- Familiarity with business performance metrics
- Data cleaning and organization skills
- Understanding operational processes
- Communication with management teams
These abilities form a strong foundation for data analytics.
Instead of starting from zero, MIS professionals only need to build additional analytical skills on top of their existing knowledge.
Once they begin analyzing data instead of simply reporting it, their role naturally begins evolving toward analytics.
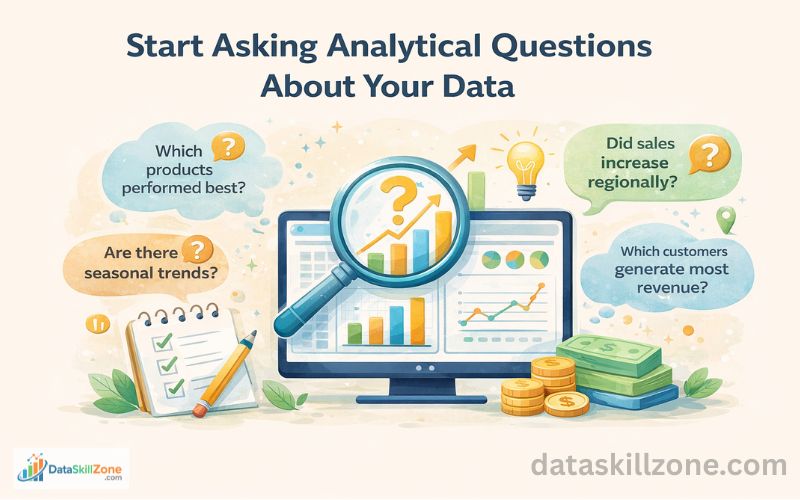
1. Start Asking Analytical Questions About Your Data
The first step toward becoming a data analyst is not learning a new tool. It is learning how to think differently about data.
Many MIS professionals generate reports every day without questioning what the numbers actually mean. They focus on delivering accurate information but rarely explore deeper insights.
To move toward analytics, you must start asking questions about the data you already work with.
Imagine you prepare a monthly sales report. Instead of simply sharing the spreadsheet, you could start examining patterns within the numbers.
For example, you might ask:
- Which products performed best this quarter?
- Did sales increase in specific regions?
- Are there seasonal trends affecting demand?
- Which customers contribute the most revenue?
When you start exploring these questions, something interesting happens.
You begin shifting from data reporting to data interpretation.
Managers and decision-makers often value employees who can explain what the numbers mean rather than simply presenting raw data.
For instance, if a sales report shows declining numbers for a particular product, an MIS professional with analytical thinking might investigate deeper and discover that the decline started after a pricing change or a supply issue. Identifying such insights can help management take quick corrective action.
For example, instead of sending a report showing sales figures, you could include observations like:
“Sales in the northern region increased by 12% this quarter, mainly due to strong demand for product category A.”
Small insights like this demonstrate analytical thinking and make your reports far more useful for decision-making.
Over time, this habit of questioning data will help you develop the mindset required for analytics roles.
2. Transform Static Reports Into Interactive Dashboards
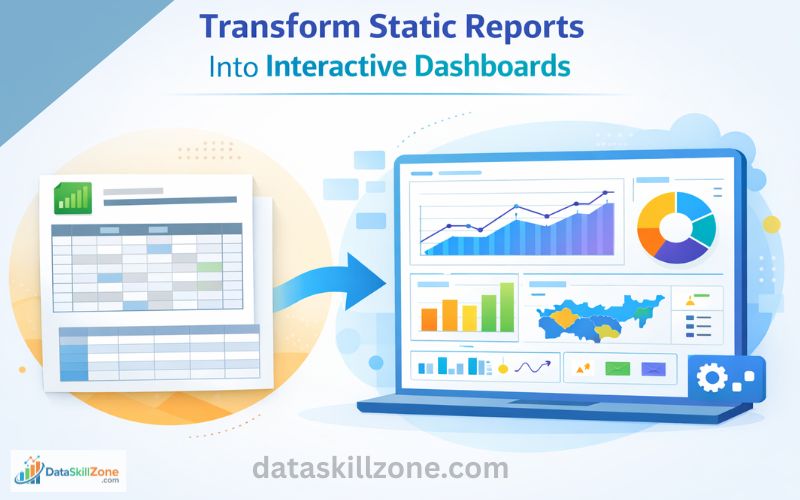
Traditional MIS reports often consist of large Excel sheets with hundreds or even thousands of rows of data. While these spreadsheets contain valuable information, they are not always easy to understand.
Modern organizations prefer visual dashboards because they allow decision-makers to quickly grasp trends and patterns.
Learning dashboard tools is therefore one of the fastest ways to upgrade your MIS reporting skills.
Some widely used business intelligence tools include:
- Microsoft Power BI
- Tableau
- Google Looker Studio
These business intelligence tools allow you to convert raw datasets into visually engaging dashboards that highlight key metrics and performance indicators.
Tools like Microsoft Power BI allow professionals to transform raw datasets into interactive dashboards that support faster business decisions.
For example, instead of sending an Excel file with monthly sales data, you could create a dashboard that displays:
- monthly revenue trends
- top-performing products
- region-wise sales performance
- customer growth patterns
Visual dashboards make it easier for managers to understand business performance at a glance.
When your dashboards start appearing in meetings and presentations, your role naturally becomes more strategic.
Instead of just preparing reports, you are now helping teams interpret data and monitor business performance.
This shift significantly increases your professional value inside the organization.
3. Automate Repetitive Reporting Tasks
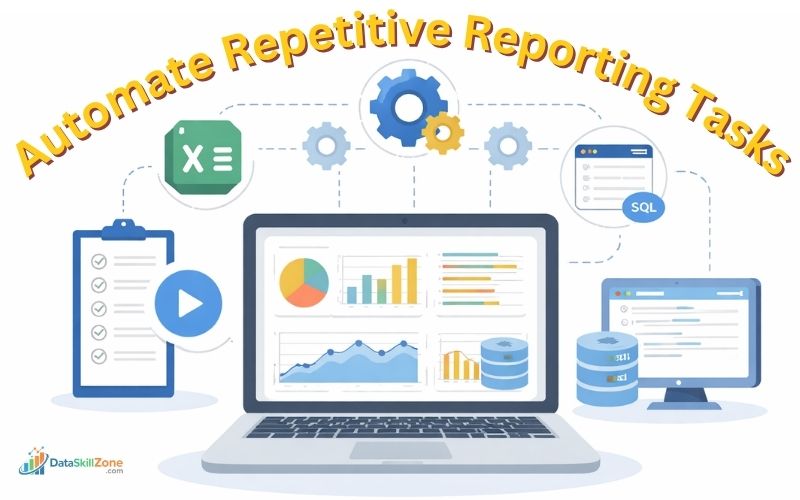
Many MIS professionals spend a large portion of their time performing repetitive tasks such as copying data, cleaning spreadsheets, and updating reports.
While these activities are necessary, they can consume hours that could otherwise be spent analyzing data.
Automation is therefore a powerful way to improve productivity and move closer to the MIS to Data Analyst transition.
Many modern data analysts spend less time preparing reports and more time interpreting data because automation tools handle repetitive tasks automatically.
Several tools can help automate routine reporting processes.
- For example, Excel’s Power Query feature allows you to automatically clean and transform data before generating reports. Instead of manually adjusting spreadsheets every day, Power Query can perform these steps automatically whenever new data is imported.
- Similarly, dashboard tools like Power BI allow you to create automated reports that update whenever the underlying data changes.
- Another powerful automation technique involves writing SQL queries to retrieve data directly from company databases. Instead of manually exporting datasets, SQL allows you to extract exactly the information you need.
When repetitive tasks become automated, you free up valuable time that can be spent exploring patterns and generating insights.
This shift from manual reporting to automated data processing is one of the key characteristics of modern analytics roles.
The journey from MIS reporting roles toward data analytics usually begins when professionals start moving beyond reporting and begin interpreting trends.
4. Learn SQL to Work With Real Business Data
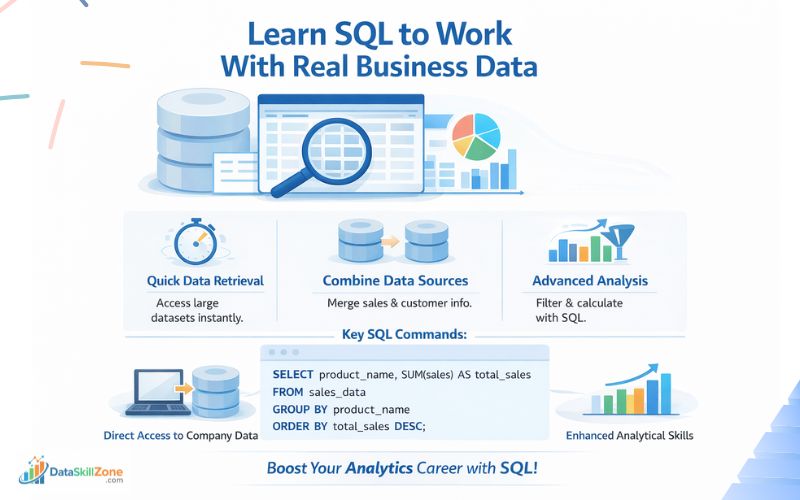
SQL (Structured Query Language) is one of the most important technical skills for data analysts.
While many MIS professionals work mainly with Excel exports, SQL allows you to access and analyze data directly from company databases.
If you want to understand the basics of SQL queries, the W3Schools SQL Tutorial provides a beginner-friendly explanation of how SQL works.
Learning SQL provides several advantages.
- First, it allows you to retrieve large datasets quickly. Instead of waiting for someone else to export information, you can write queries that extract the required data within seconds.
- Second, SQL enables you to combine multiple data sources. For example, you might merge sales data with customer information to analyze purchasing patterns.
- Third, SQL helps you perform advanced filtering and calculations that would be difficult to handle manually in spreadsheets.
Even a basic understanding of SQL commands such as SELECT, WHERE, GROUP BY, and JOIN can significantly enhance your analytical capabilities.
SELECT product_name, SUM(sales) AS total_sales
FROM sales_data
GROUP BY product_name
ORDER BY total_sales DESC;
This query calculates total sales for each product and sorts them from highest to lowest. Queries like this allow analysts to quickly identify top-performing products.
Many professionals report that learning SQL was the turning point in their analytics journey because it gave them direct access to the organization’s data infrastructure.
Learning SQL is often considered one of the most important steps in the MIS to Data Analyst career path.
Once you become comfortable retrieving and manipulating datasets using SQL, your ability to perform deeper analysis improves dramatically.
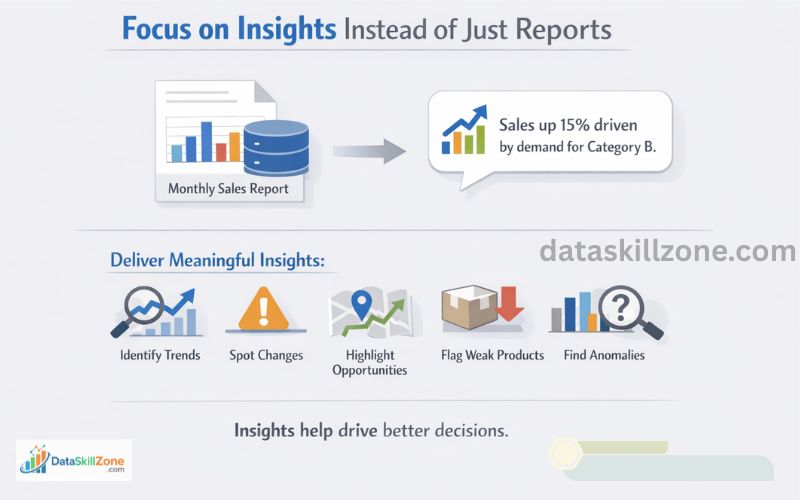
5. Focus on Insights Instead of Just Reports
One of the biggest differences between MIS executives and data analysts is how they communicate information.
Many professionals working in reporting roles eventually explore the MIS to Data Analyst transition as companies increasingly rely on deeper data insights.
MIS professionals typically send reports containing numbers and tables. Data analysts go a step further by explaining what those numbers actually mean.
To transition into analytics, you should start focusing on insights rather than simply presenting raw data.
For example, instead of writing:
“Attached is the monthly sales report.”
You could write:
“Sales increased by 15% compared to last month, mainly driven by higher demand for product category B.”
By highlighting important observations, you help decision-makers understand the significance of the data.
Insights can include:
- identifying trends in customer behavior
- detecting sudden changes in sales performance
- highlighting regions with strong growth potential
- identifying underperforming products
- identifying unexpected anomalies in business performance
When managers start receiving insights along with reports, they begin to view you as someone who contributes to strategic decision-making.
This is one of the most important steps in transitioning toward a data analytics role.
6. Collaborate With Multiple Business Departments
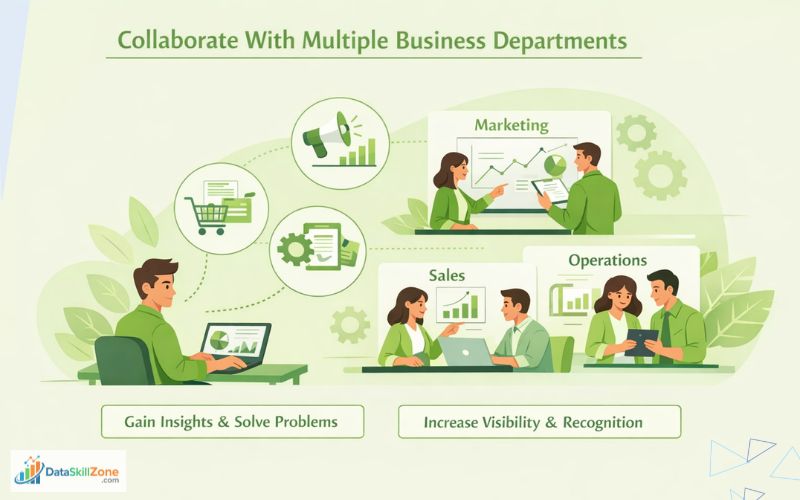
Data analysts often work closely with different departments within an organization. These departments rely on analytics to improve performance and optimize strategies.
As an MIS professional, you can start collaborating with various teams to provide deeper data insights.
For instance:
- Marketing teams may need help analyzing campaign performance.
- Sales teams might require reports showing customer purchasing patterns.
- Operations teams may want data that helps improve efficiency.
By supporting these departments, you gain exposure to different business problems and develop a broader understanding of how data can drive decision-making.
This cross-functional collaboration also increases your visibility within the organization.
When multiple departments begin relying on your analytical support, it becomes easier for management to recognize your potential for analytics roles.
Collaboration with different departments also helps professionals progress in the MIS to Data Analyst journey.
7. Build Internal Recognition for Your Analytical Contributions
Career transitions inside a company often happen gradually rather than suddenly.
Instead of waiting for a formal promotion, focus on demonstrating your analytical capabilities through your work.
You can build recognition by:
- presenting dashboards during team meetings
- sharing insights with managers
- suggesting data-driven improvements
- highlighting business trends in reports
When leadership consistently sees your analytical contributions, they begin to associate you with data-driven decision-making.
Over time, this recognition can lead to expanded responsibilities, new projects, and even formal role transitions into analytics positions.
In many cases, professionals who actively demonstrate their analytical skills are eventually given opportunities to work on larger data initiatives within the company.
Essential Skills Needed for the MIS to Data Analyst Transition
To successfully transition from MIS reporting to data analytics, professionals should focus on developing a combination of technical and analytical skills.
Important skills include:
- Advanced Excel for data analysis
- SQL for querying business databases
- Power BI or Tableau for dashboard creation
- Data visualization techniques
- Basic statistics for data interpretation
- Business understanding and problem solving
Developing these skills gradually can significantly accelerate the transition from MIS executive to data analyst.
Common Mistakes MIS Professionals Should Avoid
While transitioning toward analytics, some professionals slow their progress by making avoidable mistakes.
One common mistake is trying to learn too many tools at once. The analytics field includes a wide range of technologies, but beginners should focus on mastering a few essential tools first.
Another mistake is focusing only on theory without practicing real data analysis. Watching tutorials alone is not enough; practical experience is essential for developing analytical thinking.
Some professionals also underestimate the importance of business understanding. Analytics is not only about technical tools. It also involves understanding how data affects real business decisions.
Finally, many professionals fail to share their insights with management. Even strong analysis has limited impact if it is not communicated effectively.
Avoiding these mistakes can help accelerate your career transition.
How long to move from MIS to data analyst?
The timeline for moving from MIS reporting to data analytics varies depending on several factors, including learning effort, workplace opportunities, and the availability of analytical projects.
However, many professionals complete the MIS to Data Analyst transition within six to twelve months when they consistently practice these skills.
The most important factor is not simply learning new tools but demonstrating how those tools can improve business decision-making.
When organizations see the value of your analytical contributions, they are more likely to provide opportunities that allow your role to evolve.
You can also read about my practical experience in How I Built My Career in MIS and Data Field to understand real-world career growth strategies.
My Final Overview
For many professionals exploring the MIS to Data Analyst transition, the change may initially seem challenging.
In reality, MIS executives are already working with the same business data that analysts rely on every day.
By gradually developing analytical thinking, learning tools such as SQL and dashboard software, and sharing meaningful insights with management, MIS professionals can transform their role without leaving their current organization.
As businesses continue to depend on data-driven strategies, professionals who can interpret numbers and communicate insights will remain highly valuable.
For MIS executives looking to grow their careers, upgrading their role into a data analytics position can be one of the most practical and rewarding steps they take in their professional journey.
As organizations continue to prioritize data-driven strategies, professionals who can transform raw data into meaningful insights will remain in high demand across industries.
If you are planning to move into the analytics field and are curious about real job opportunities, you can also explore our detailed guide on Entry Level Data Analyst Jobs where we explain how beginners can start their data analytics career even without prior industry experience.
When you learn to turn data into insights, you turn your career into opportunity.
FAQs
Yes. A MIS degree already gives you a strong foundation in data handling, reporting, and business systems. With skills like Excel, SQL, and basic visualization tools, you can easily transition into a data analyst role.
They are not directly comparable. MIS is a degree or field of study, while data analyst is a job role. MIS can actually lead to a data analyst career, so they often complement each other rather than compete.
Yes. Many data analysts come from non-IT backgrounds. With the right skills—such as Excel, SQL, and basic data analysis—you can enter the field without a technical degree.
Key skills include Excel, SQL, data visualization tools (like Power BI or Tableau), and basic statistics. Problem-solving and the ability to interpret data are just as important as technical skills.
Certifications are not mandatory, but they can boost your profile. Practical projects, hands-on experience, and a strong portfolio often matter more to employers.
Yes. You can transition internally by taking on analytical tasks, building dashboards, and sharing insights.
1 Comment