Introduction to SQL for Data Analysis
SQL for data analysis is a language used to extract, filter, and analyze data stored in relational databases. It helps analysts generate insights from large datasets quickly and efficiently.
In today’s digital world, businesses generate massive amounts of data every single day. Companies collect information from online stores, financial transactions, marketing campaigns, and operational systems.
Such as:
- Online stores track customer purchases
- Banks monitor financial transactions
- Marketing teams analyze campaign performance
- Logistics companies manage inventory and delivery operations
All of this information is stored in databases.
However, collecting data is only the first step. The real challenge is extracting meaningful insights from that data so organizations can make better decisions.
For example, companies want answers to questions like:
- Which products generate the highest revenue?
- Which customers purchase the most frequently?
- Which marketing campaign generated the best results?
- How are monthly sales trends changing over time?
Finding answers to these questions manually would be extremely difficult if datasets contain thousands or millions of records.
This is where SQL (Structured Query Language) becomes an essential tool.
SQL for data analysis allows analysts to communicate directly with databases and retrieve the exact information they need.
Instead of scrolling through endless rows of data, analysts can write queries that instantly return useful insights.
Because of this capability, SQL has become one of the most important technical skills for professionals working in data-related roles, including:
- Data Analysts
- Business Analysts
- MIS Executives
- Data Scientists
- Business Intelligence Developers
In this guide, you will learn how SQL works, how databases organize information, and how analysts use SQL queries to explore and analyze business data in real-world situations.
How Databases Store Data for SQL Data Analysis
Before learning SQL queries, it is important to understand how databases organize information.
Most companies use relational databases to store structured data.
A relational database stores information in tables. Each table has rows & columns, the same like a spreadsheet.
For example, a company might maintain a table that stores information about customers.
| Customer_ID | Name | City | Age |
| 101 | Rahul | Mumbai | 28 |
| 102 | Sara | Delhi | 32 |
| 103 | Amit | Bangalore | 25 |
In this table:
- Each row represents a single customer
- Every column represents a separate data field related to the customer.
However, businesses usually store different types of data in separate tables.
For example, orders placed by customers might be stored in another table.
| Order_ID | Customer_ID | Product | Amount |
| 5001 | 101 | Laptop | 800 |
| 5002 | 102 | Phone | 600 |
| 5003 | 101 | Tablet | 400 |
Notice that the Customer_ID column appears in both tables.
This column connects the two tables together, allowing analysts to combine information when necessary.
SQL provides the tools needed to work with these tables efficiently.
What SQL Is and Why It Matters for Data Analysis
SQL stands for Structured Query Language. It is a programming language specifically designed for interacting with relational databases.
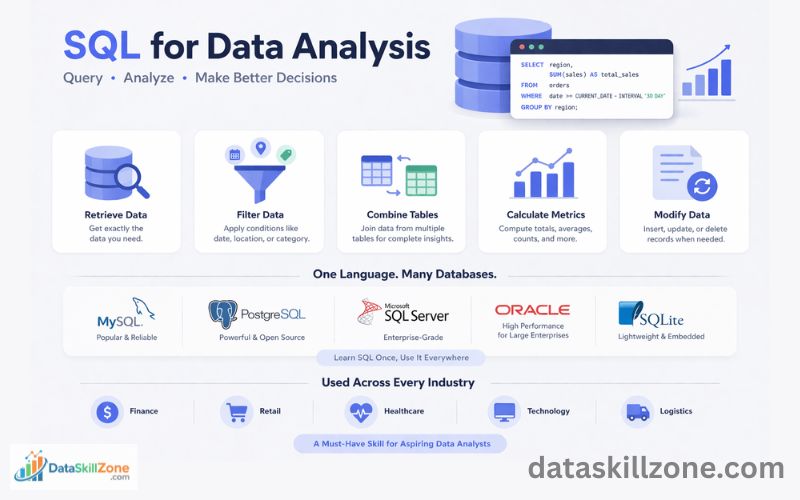
Using SQL, analysts and data professionals can perform several important tasks such as:
- Retrieving specific data from a database
Analysts can extract only the data they need rather than viewing the entire dataset. For example, they can retrieve all sales made in the last 30 days. - Filtering information based on conditions
SQL queries allow users to apply conditions using filters like date ranges, locations, or product categories. - Combining multiple tables
In real databases, information is often stored across several tables. SQL allows analysts to join these tables together and create a complete dataset for analysis. - Calculating totals, averages, and other metrics
SQL can perform calculations such as total sales, average order value, or number of customers in each region. - Updating, inserting, or deleting records
Database administrators and engineers can use SQL to maintain and modify stored data when necessary.
The main advantage of SQL is its ability to work with very large datasets. Even if a database contains millions of rows, SQL queries can retrieve results within seconds.
Another important reason SQL matters is that it is considered a universal database language.
Most popular SQL Tools Includes:
- MySQL provide detailed documentation for learning SQL and database management.
- Another widely used open-source database is PostgreSQL, which offers powerful features for advanced data analysis.
- Many enterprise organizations use Microsoft SQL Server for managing large business databases.
- Large enterprises often rely on Oracle Database for high-performance database systems.
These database systems are widely used for SQL for data analysis, allowing analysts to query large datasets efficiently.
Lightweight applications and mobile apps often use SQLite because it is simple and does not require a separate server.
all use SQL as their core query language.
This means that once you learn SQL, the same knowledge can be applied across different database technologies.
Because of its efficiency and flexibility, SQL is widely used across industries such as finance, retail, healthcare, technology, and logistics.
For anyone interested in becoming a data analyst, business analyst, or data scientist, SQL is one of the most valuable skills to learn.
SQL is considered one of the most important skills for data professionals. If you want to understand the full learning path, you can follow this Complete Data Analyst Career Roadmap (2026) that explains the skills beginners need to become data analysts.
Basic SQL Query Structure for Data Analysis
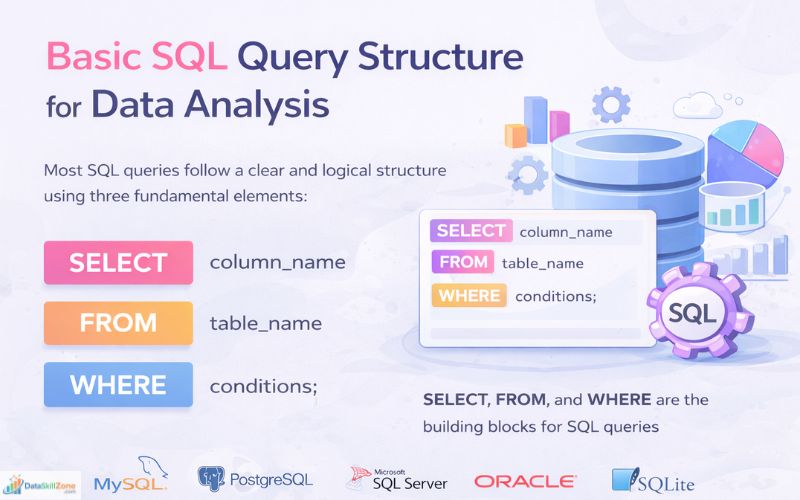
Although SQL is a powerful language used to work with large databases, its syntax is surprisingly simple and beginner-friendly. One of the reasons SQL is widely adopted in the data analytics world is that most queries follow a clear and logical structure.
At its core, SQL works like asking a question to a database. You tell the database what data you want, where that data is stored, and under what conditions it should be returned.
You can learn more about SQL syntax and commands in the official MySQL documentation.
Most SQL queries are built using three fundamental components:
- SELECT
- FROM
- WHERE
Understanding these three elements is the first step toward writing effective SQL queries.
SELECT – Choosing the Data You Want
The SELECT statement determines which columns of data should be returned from the database.
Databases usually contain many columns within a table, but in most cases analysts only need a few of them for analysis. The SELECT statement allows you to choose exactly which fields should appear in the query results.
For example, if a customer database contains columns like:
- customer_id
- name
- city
- signup_date
An analyst might only need the name and city columns for a particular report. The SELECT statement allows the analyst to request only those specific fields instead of retrieving the entire dataset.
Using SELECT makes queries more efficient and helps keep the results clean, focused, and easier to analyze.
FROM – Identifying the Data Source
The FROM clause tells SQL where the requested data is located. It specifies the table that the query should read from.
In relational database systems, information is usually divided into multiple tables so that it stays organized and easy to manage. For instance, a company database might include tables such as:
- customers
- orders
- products
- payments
Each table stores a particular category of information. The FROM clause directs SQL to the correct table that contains the data requested in the query.
Without this clause, the database engine would not know which table should be used to retrieve the requested records.
WHERE – Applying Conditions to Data
The WHERE clause is used when you need to return only certain records from a table. Instead of retrieving every row, you can apply conditions that limit the results.
In real business analysis, working with the full dataset is rarely necessary. Analysts usually focus on specific portions of data, for example:
- customers living in a certain city
- sales generated during the last 30 days
- orders whose value is above a specific amount
- products that belong to a particular category
The WHERE clause allows these types of filters by evaluating logical conditions in the query.
Because of this capability, SQL enables analysts to focus on only the relevant data, making analysis faster and more meaningful.
Example of a Basic SQL Query
A typical SQL query combines the SELECT, FROM, and WHERE clauses together. Here is a simple example:
FROM customers
WHERE city = ‘Mumbai’;
Here is how this query works:
- SELECT name, city → chooses the columns that will appear in the result
- FROM customers → tells SQL to read data from the customers table
- WHERE city = ‘Mumbai’ → filters the results so only customers from Mumbai are included
The output will display a list containing the names and cities of customers who live in Mumbai.
Although the example is simple, it illustrates a key advantage of SQL: the ability to retrieve specific information from very large datasets.
In real business databases, tables may contain millions of rows, but well-written SQL queries can still extract the required information in just a few seconds.
This efficiency is one of the main reasons SQL remains a fundamental skill for data analysts, business analysts, and database professionals.
Retrieving Data Using the SELECT Statement
The SELECT statement is the most commonly used command in SQL. It is responsible for retrieving information stored inside database tables.
Whenever analysts want to examine or analyze stored data, they begin by writing a SELECT query.
One of the advantages of the SELECT statement is that it allows you to control exactly which columns appear in the results.
Instead of retrieving the entire dataset, you can request only the fields that are necessary.
For example, if you want to display the names of customers stored in the database, you can write the following query:
FROM customers;
This query instructs the database to return values from the name column of the customers table.
If you need additional information, you can include more columns by separating them with commas.
FROM customers;
This query will return three columns—name, city, and age—for each record in the customers table.
In some situations, analysts want to quickly view all columns in a table, especially when exploring a new dataset. SQL offers a shortcut for this by using the asterisk (*) symbol.
FROM customers;
The asterisk tells SQL to return every column available in the table.
Although this can be convenient for quick inspection, experienced analysts avoid using SELECT * on large tables because it retrieves unnecessary data. Requesting only the required columns usually results in better performance and cleaner results.
Filtering Records Using the WHERE Clause
In real data analysis projects, analysts rarely analyze an entire table at once. Large databases often contain thousands or millions of rows, and examining all of them may not be practical.
Instead, analysts typically narrow the dataset by applying filters that match specific conditions. This is where the WHERE clause becomes very useful.
The WHERE clause restricts the query results so that only rows meeting the specified conditions are returned.
For example, suppose a company wants to analyze customers who live in Delhi. The following query can be used:
FROM customers
WHERE city = ‘Delhi’;
This query retrieves every column from the customers table, but only for records where the city value is Delhi.
In many situations, analysts combine multiple conditions to refine the results further. SQL supports this using logical operators such as AND and OR.
For example:
FROM customers
WHERE city = ‘Delhi’ AND age > 30;
This query returns customers who meet both conditions:
- they live in Delhi
- their age is greater than 30
Filtering data in this way helps analysts concentrate on relevant records, making it easier to identify patterns, trends, and insights in the dataset.
Sorting Data Using ORDER BY
After retrieving data, analysts often arrange the results in a logical order so that the information becomes easier to interpret.
The ORDER BY clause is used to sort query results based on the values of one or more columns. Sorting helps analysts quickly identify rankings, patterns, or extreme values in the data.
For example, suppose you want to view orders starting with the highest value. The following query can be used:
FROM orders
ORDER BY amount DESC;
In this query:
- ORDER BY amount specifies the column used for sorting
- DESC stands for descending order, meaning the largest values appear first
Sorting results helps analysts quickly spot top transactions, highest sales values, or other important metrics within a dataset.
If you want to sort values from lowest to highest, you can use the ASC (ascending) keyword instead.
FROM orders
ORDER BY amount ASC;
Ascending order is often used when analysts want to see the smallest values first, such as the lowest sales amounts or the earliest dates.
Sorting data is an important step in data analysis because it helps analysts quickly identify trends, rankings, and extreme values within a dataset.
For example, sorting sales data can reveal top-performing products, highest-value customers, or the most profitable transactions.
Limiting Query Results
Large datasets often contain thousands or even millions of records. When analysts are exploring a new dataset, retrieving all rows at once can be unnecessary and sometimes slow down query performance.
To avoid this, analysts often retrieve only a small sample of the data to quickly understand the structure of the table and the type of information it contains.
The LIMIT clause is used to control how many rows a query returns. This is especially useful when previewing large tables or testing queries during analysis.
For example, the following query retrieves only the first ten rows from the orders table:
FROM orders
LIMIT 10;
In this query, the LIMIT 10 instruction tells the database to return only ten records, even if the table contains thousands of rows.
Using LIMIT helps analysts inspect datasets quickly, test queries efficiently, and avoid retrieving unnecessary records.
It is commonly used during the early stages of data exploration to get a quick snapshot of the available data before performing deeper analysis.
Aggregation Functions in SQL
In most business scenarios, companies are more interested in summarized insights rather than individual records.
Instead of analyzing each row of data separately, analysts often calculate overall metrics such as total sales, average revenue, or the number of transactions.
SQL provides several aggregation functions that perform calculations across multiple rows of data and return a single summarized value.
These functions help analysts quickly generate important business metrics from large datasets.
Some of the most widely used aggregation functions are:
- COUNT() – Determines how many rows exist in a dataset or group.
- SUM() – Adds together all numeric values in a selected column.
- AVG() – Calculates the mean value of the numbers in a column.
- MAX() – Identifies the largest value present in a column.
- MIN() – Identifies the smallest value present in a column.
For example, if a company wants to calculate the total sales revenue, the following SQL query can be used:
FROM orders;
This query adds together all values in the amount column of the orders table to produce the total revenue.
Similarly, analysts may want to calculate the average order value, which helps businesses understand how much customers typically spend per order.
SELECT AVG(amount)
FROM orders;
This query calculates the average value of all orders stored in the dataset.
Aggregation functions are extremely important in data analysis because they help companies summarize large volumes of data into meaningful metrics, making it easier to monitor business performance and make informed decisions.
Using GROUP BY for Data Analysis
In business environments, analysts often need to examine data by categories rather than looking at all records together.
For example, companies may want to analyze performance by city, product category, region, department, or time period.
The GROUP BY clause helps accomplish this by grouping rows that share the same values in a specified column.
Once the data is grouped, SQL aggregation functions such as COUNT(), SUM(), AVG(), MAX(), or MIN() can be applied to each group.
This makes it possible to generate summarized insights for different segments of data.
For example, suppose a company wants to count how many customers live in each city. The following SQL query can be used:
FROM customers
GROUP BY city;
In this query:
- city is the column used to group the data
- COUNT(*) counts the number of records in each group
- AS total_customers assigns a readable name to the result column
The output might look something like this:
| City | Total Customers |
| Mumbai | 5 |
| Delhi | 3 |
| Bangalore | 4 |
This type of grouped analysis helps businesses understand patterns and distributions within their data. For example, companies can identify which cities have the highest number of customers, which regions generate the most sales, or which products are most popular in different markets.
Because of this capability, GROUP BY is one of the most important SQL features used in real-world data analysis and reporting.
Combining Tables Using SQL Joins
In most databases, useful information is stored across multiple tables.
To analyze this data together, SQL provides a feature called joins. SQL joins allow analysts to combine rows from two or more tables based on a related column.
For example, suppose you want to see which customer placed each order. This requires combining the customers table with the orders table.
FROM customers
INNER JOIN orders
ON customers.customer_id = orders.customer_id;
In this query:
- INNER JOIN combines the two tables.
- customers.customer_id = orders.customer_id defines the relationship between the tables.
- The query retrieves the customer’s name along with the product purchased and the order amount.
The result will display customer names alongside their purchases, making it easier to analyze customer behavior and transaction data.
Joins are extremely important in SQL because they allow analysts to connect related datasets and build complete views of business information. Without joins, it would be difficult to perform meaningful analysis on relational databases where data is spread across multiple tables.
Real Business Example: Identifying Top Customers
Businesses often want to identify customers who generate the most revenue.
These customers often contribute a large portion of total sales, and understanding their behavior can help companies improve marketing strategies and customer retention.
SQL makes it easy to analyze this type of data by calculating total spending for each customer.
For example, the following query calculates how much each customer has spent across all orders:
SELECT customer_id, SUM(amount) AS total_spent
FROM orders
GROUP BY customer_id
ORDER BY total_spent DESC;
FROM orders
GROUP BY customer_id
ORDER BY total_spent DESC;
In this query:
- SUM(amount) calculates the total value of all orders placed by each customer.
- GROUP BY customer_id groups the orders so that spending can be calculated for each individual customer.
- ORDER BY total_spent DESC organizes the output by total spending, placing the biggest spenders at the top.
The final result produces a ranked list of customers based on total spending. This allows businesses to quickly identify their most valuable customers.
Marketing teams can use this information to design loyalty programs, personalized offers, or targeted promotions aimed at rewarding high-value customers and encouraging repeat purchases. This type of analysis is a common example of how SQL supports data-driven decision making in real business environments.
SQL in Real Business Workflows
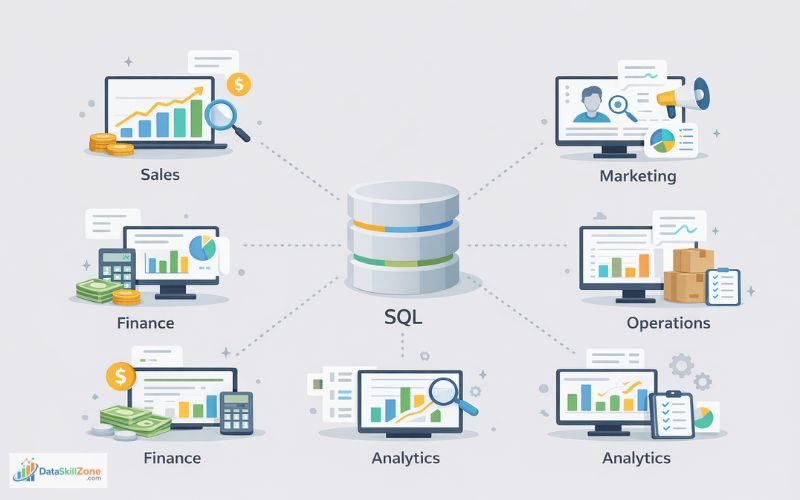
SQL plays an important role in many business operations.
Different departments within a company rely on SQL to access and analyze the data relevant to their operations. Some common examples include:
- Sales teams analyze revenue trends
Sales managers often use SQL to track total sales, compare monthly revenue, and identify top-performing products or regions. - Marketing teams study customer behavior
Marketers analyze customer data to understand purchasing patterns, evaluate campaign performance, and identify high-value customer segments. - Finance departments generate financial reports
Finance professionals use SQL to retrieve data for reports related to income, expenses, profitability, and budgeting. - Operations teams monitor inventory and logistics
Operations teams rely on SQL queries to track stock levels, monitor supply chains, and analyze delivery performance. - Product and business analysts explore user data
Analysts frequently use SQL to examine user activity, product usage patterns, and other operational metrics that support business decisions.
Analysts use SQL to extract raw data from databases, which is then cleaned, analyzed, and visualized using tools such as Excel, Power BI, Tableau, or Python.
If you want to learn how to build dashboards and reports, you can read Power BI Developer Guide (2026), a complete beginner to advanced tutorial.
Because of this, SQL is considered one of the foundational skills for anyone working in data-related roles, including data analysts, business analysts, and data engineers.
Many professionals who learn SQL move into high-paying data roles, including positions that allow remote work. You can explore some of these opportunities in this list of high-paying remote data careers.
Best Ways to Practice SQL
Learning SQL is fairly straightforward, but improving your skills requires regular hands-on practice.
Writing queries frequently helps you understand how databases work and how to retrieve useful information from data.
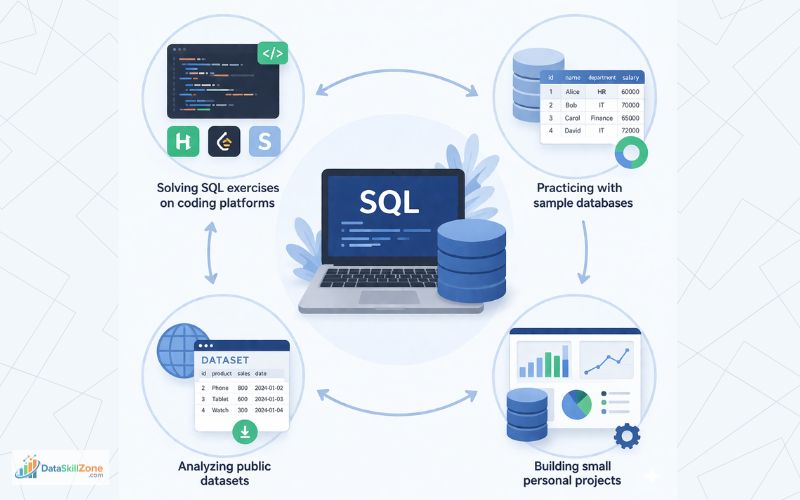
Some effective ways to practice SQL include:
- Solving SQL exercises on coding platforms
Websites like HackerRank, LeetCode, and StrataScratch offer practical SQL challenges that help you improve query-writing skills. - Practicing with sample databases
Many database systems provide sample datasets such as sales, employee, or e-commerce data that you can use for learning. - Analyzing public datasets
Open datasets from sources like Kaggle or government portals allow you to practice real-world data analysis using SQL. - Building small personal projects
Creating simple projects like analyzing sales data or customer trends helps reinforce your SQL knowledge.
Many analysts practice SQL using real datasets available on Kaggle.
Regular practice helps you write queries faster, understand database structures, and interpret results more effectively, which are essential skills for data analysts.
Essential SQL Skills for Data Analysis
To succeed as a data analyst, it is important to develop a strong foundation in several core SQL skills. These skills allow analysts to retrieve, organize, and analyze data stored in relational databases.
Some of the most important SQL skills include:
- Retrieving data using SELECT queries
Analysts must know how to extract specific columns and records from database tables. - Filtering data with WHERE conditions
This helps narrow down datasets by applying conditions such as location, date, or numerical values. - Grouping records using GROUP BY
Grouping allows analysts to summarize data by categories like city, product, or department. - Combining tables using SQL joins
Joins help connect related tables so analysts can analyze complete datasets. - Using aggregation functions
Functions like COUNT(), SUM(), AVG(), MAX(), and MIN() help generate important business metrics. - Sorting and organizing results
Clauses such as ORDER BY make it easier to analyze data by arranging results logically.
Developing these skills enables professionals to work effectively with real business data.
Common Mistakes Beginners Make
Beginners often make mistakes when writing SQL queries.
Some of the most common mistakes include:
- Forgetting proper join conditions
When combining tables using joins, beginners sometimes forget to specify the correct relationship between tables. This can produce incorrect results or generate a large number of duplicate rows. - Retrieving unnecessary columns
Beginners often write SELECT * when they want to retrieve all columns in a table. While this can be useful during exploration, it is not recommended for large datasets because it retrieves unnecessary data and can slow down query performance. - Not filtering data properly
Beginners sometimes forget to apply the correct conditions in the WHERE clause, which may result in retrieving more data than required. - Ignoring query efficiency
Writing queries that scan large amounts of unnecessary data can reduce performance. Learning to write clean and optimized queries is an important skill for analysts.
By practicing regularly and understanding how tables relate to each other, beginners can avoid these common issues and improve their SQL skills much faster.
Final POV
SQL provides a powerful way to handle and analyze structured datasets. It allows analysts to retrieve, analyze, and summarize information stored in relational databases.
Whether a company wants to understand customer behavior, evaluate marketing campaigns, or monitor financial performance, SQL provides the ability to extract meaningful insights from large datasets.
For anyone interested in becoming a data analyst, learning SQL is an essential step.
When combined with tools such as Excel, Power BI, or Python, SQL becomes part of a powerful toolkit that enables professionals to transform raw data into valuable insights that support better business decisions.
Mastering SQL for data analysis allows professionals to work with large business datasets and generate meaningful insights that support strategic decision-making.
FAQs
SQL is one of the most important skills for data analysts, but it is usually not enough on its own. Most data analysts also use tools such as Excel, Power BI, Tableau, and sometimes Python to analyze and visualize data. However, strong SQL skills are often the foundation of most data analysis workflows.
Several database systems support SQL, but the most commonly used for data analysis include PostgreSQL, MySQL, Microsoft SQL Server, and SQLite. PostgreSQL is especially popular among data analysts because of its advanced analytical features and strong performance.
Yes, many data analysts use SQL daily. SQL is commonly used to extract data from databases, filter records, combine multiple datasets, and generate reports. In many organizations, SQL queries are the primary way analysts retrieve data for dashboards and analysis.
Some of the most essential SQL commands for data analysis include:
- SELECT
- WHERE
- GROUP BY
- ORDER BY
- JOIN
- COUNT()
- SUM()
- AVG()
These commands allow analysts to retrieve, filter, and summarize business data efficiently.
In real-world business environments, SQL is used to analyze customer behavior, track sales performance, evaluate marketing campaigns, and monitor operational metrics. Analysts write SQL queries to retrieve relevant data and then use visualization tools to present insights to decision-makers.
Yes, SQL is beginner-friendly and does not require a programming background. The language uses simple commands that resemble natural English, making it easier for beginners to understand compared to many other programming languages.
SQL is primarily used to retrieve and manipulate data stored in databases, while Python is often used for advanced data analysis, automation, and machine learning. Many data analysts use SQL to extract data and Python to perform deeper analysis or build predictive models.
Some beginner-friendly SQL projects include:
- Analyzing e-commerce sales data
- Identifying top customers by revenue
- Tracking monthly sales trends
- Analyzing marketing campaign performance
- Studying customer purchase behavior
These projects help beginners practice real-world data analysis techniques.
Data analysts typically need to know intermediate-level SQL, including joins, aggregation functions, filtering, and grouping. Advanced concepts like window functions and subqueries can further improve an analyst’s ability to work with complex datasets.
Yes, SQL remains one of the most in-demand skills in the data analytics industry. Many job listings for data analysts, business analysts, and data scientists specifically require SQL knowledge because most organizations store their data in relational databases.
3 Comments