
Introduction
Data is now considered one of the most valuable resources for modern organizations.
Companies today collect information from sales transactions, marketing campaigns, customer interactions, and operational systems. While collecting data is easy, turning that data into meaningful insights is the real challenge.
In the past, many organizations relied heavily on spreadsheets to analyze their numbers.
Tools like Microsoft Excel were used to create reports and track business performance. However, as companies started generating larger datasets, traditional spreadsheets began to show limitations.
This shift created the need for advanced data visualization tools that could analyze large amounts of information quickly and present it in a way that decision-makers could easily understand.
One of the most popular tools designed for this purpose is Microsoft Power BI.
Power BI allows users to connect different data sources, transform raw datasets, and convert them into interactive dashboards and reports.
Because of its powerful capabilities and ease of use, Power BI has become widely adopted across industries.
As a result, the role of a Power BI Developer has become increasingly important. Businesses now require professionals who can design dashboards, build data models, and transform complex datasets into meaningful insights.
If you are planning to start a career in analytics, following a structured data analyst career roadmap can help you understand which tools and skills to learn first.
This guide will help you understand everything you need to know about Power BI and the role of a Power BI Developer.
We will start from the fundamentals and gradually move toward advanced concepts, including dashboards, database connections, and career opportunities.
What is Power BI
Power BI is a Microsoft-developed platform used for analyzing data and presenting insights through charts, reports, and dashboards.
It helps businesses analyze data and present insights through interactive dashboards and reports.
Instead of working with large spreadsheets full of numbers, Power BI allows users to visualize information using charts, graphs, maps, and other visuals. This makes it much easier to understand trends, patterns, and business performance.
For example, a company that sells products online may collect thousands of sales records every day. Looking at raw data inside a spreadsheet can make it difficult to identify important insights. When the same dataset is imported into Power BI, it can quickly be transformed into visual dashboards that highlight key metrics such as revenue, top-selling products, and customer locations.
Power BI is widely used by organizations because it simplifies the entire data analysis process, from connecting data sources to creating reports.
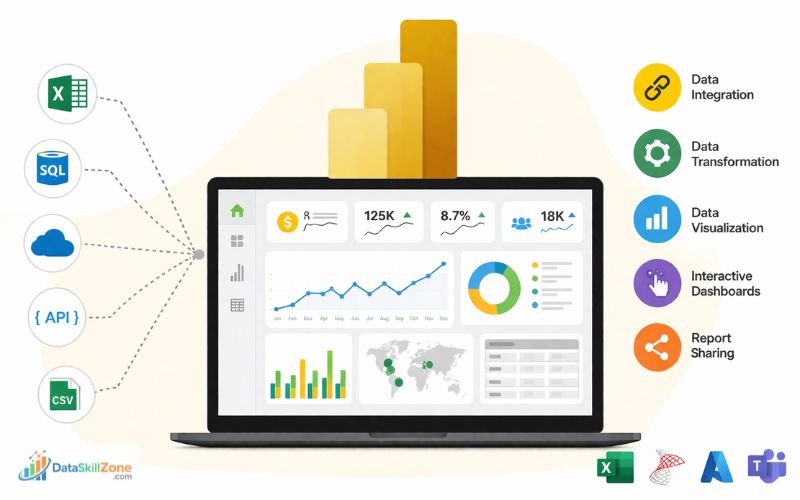
Some of the main capabilities of Power BI include:
• Data Integration – Power BI can connect to multiple data sources such as Excel files, SQL databases, cloud platforms, and APIs.
• Data Transformation – Using Power Query, users can clean and prepare data before analysis.
• Data Visualization – Power BI provides various visual tools like charts, graphs, and tables to present insights clearly.
• Interactive Dashboards – Users can filter and explore data dynamically by interacting with visuals.
• Report Sharing – Dashboards can be shared with teams through the Power BI cloud service.
Power BI is also part of the Microsoft ecosystem, which means it works smoothly with tools like Excel, SQL Server, Azure, and Microsoft Teams. This integration makes it especially popular among companies that already use Microsoft technologies.
Who is Power BI Developer

A Power BI developer is a data professional who specializes in designing, building, and maintaining dashboards and reports using Microsoft Power BI.
Because organizations rely heavily on these dashboards for decision-making, they need professionals who understand how to design and maintain them effectively.
These professionals are known as Power BI developers, and they play a key role in transforming raw data into meaningful business insights.
Their main responsibility is to transform raw business data into clear visual insights that help organizations make better decisions.
In many companies, large amounts of data are stored across different systems such as Excel files, databases, and cloud applications.
However, this raw data is often difficult for managers to understand without proper analysis. A Power BI developer bridges this gap by converting complex datasets into interactive dashboards and visual reports.
These dashboards allow business leaders to monitor performance, track key metrics, and identify trends without needing technical expertise.
Key Responsibilities of a Power BI Developer
A Power BI developer typically performs several important tasks within an organization:
• Connecting Data Sources – Importing data from sources like Excel, SQL Server, cloud databases, and APIs.
• Data Transformation – Cleaning and preparing data using Power Query to ensure accuracy and consistency.
• Data Modeling – Creating relationships between different datasets to build efficient data models.
• Building Dashboards – Designing interactive reports and dashboards that display business insights visually.
• Using DAX Formulas – Writing calculations and measures using the DAX language to perform advanced analysis.
• Optimizing Reports – Ensuring dashboards load quickly and work efficiently with large datasets.
Where Power BI Developers Work
Power BI developers are needed across many industries because almost every organization relies on data today. They commonly work in areas such as:
• Retail and e-commerce companies
• Finance and banking institutions
• Healthcare organizations
• Marketing and digital analytics teams
• Consulting and technology firms
Why the Role is Important
Businesses depend on accurate data insights to make strategic decisions. A skilled Power BI developer ensures that data is properly organized, analyzed, and presented in a way that decision-makers can easily understand.
Because of the growing demand for data analytics, the role of a Power BI developer has become one of the most valuable positions in the modern data ecosystem.
Why Businesses Need Power BI Developers

In today’s data-driven world, businesses rely heavily on accurate insights to make important decisions. From tracking sales performance to understanding customer behavior, every department depends on data.
However, raw data alone is not useful unless it is properly analyzed and presented. This is where a Power BI developer becomes essential.
A Power BI developer helps organizations convert complex datasets into meaningful dashboards that decision-makers can easily understand.
Instead of spending hours analyzing spreadsheets, managers can view real-time insights through interactive reports.
Key Reasons Businesses Hire Power BI Developers
There are several reasons why companies actively look for skilled Power BI developers:
• Faster Decision Making – With dashboards and real-time reports, businesses can quickly identify trends and take action without delays.
• Centralized Data Management – Data from multiple sources is combined into a single dashboard, making it easier to monitor performance.
• Improved Accuracy – Cleaned and well-structured data reduces errors in reporting and analysis.
• Better Data Visualization – Complex data is presented in simple visuals like charts and graphs, making it easier to understand.
• Automation of Reports – Regular reports can be automated, saving time and reducing manual work.
Real-World Example
Consider a retail company that operates across multiple cities. Without a proper reporting system, it would be difficult to track sales performance for each location.
A Power BI developer can create a dashboard that shows:
• Daily and monthly sales
• Top-performing products
• Region-wise revenue
• Inventory status
With this dashboard, management can instantly identify which locations are performing well and which areas need improvement.
Growing Demand for Power BI Developers
As more companies adopt data analytics tools, the demand for Power BI developers continues to grow.
Organizations are looking for professionals who can not only handle data but also present it in a way that supports business decisions.
Because of this increasing demand, Power BI development has become a strong career option for individuals interested in data analysis and business intelligence.
How to Download Power BI and Start Using It
If you want to begin learning data visualization and analytics, the first step is to download Power BI Desktop, which is the main tool used to create dashboards and reports.
Power BI Desktop is completely free to download and is widely used by beginners, analysts, and professional Power BI developers.
After installation, Power BI Desktop lets users connect to different data sources, prepare datasets, and create interactive reports.
Steps to Download Power BI Desktop
Follow these simple steps to install Power BI on your computer:
- Visit the official Microsoft Power BI website.
- Navigate to the Power BI Desktop download page.
- Click the Download Free button.
- Install the software on your Windows computer.
- Launch Power BI Desktop and log in using your Microsoft account.
After installation, you can immediately start importing data and creating visual reports.
System Requirements
Before downloading Power BI Desktop, make sure your computer meets these basic requirements:
• Windows 10 or later operating system
• A minimum of 4 GB RAM is needed, but 8 GB works better for handling large datasets.
• Internet connection for updates and publishing reports
• A Microsoft account is required to log in to Power BI Service.
Since Power BI Desktop is a Windows application, Mac users usually run it through virtual machines or cloud-based Windows environments.
Getting Started with Data Analysis
Once Power BI is installed, users can begin analyzing data by connecting to different sources.
Some common data sources include:
• Excel spreadsheets
• CSV files
• SQL Server databases
• Cloud platforms like Azure or Google Analytics
After importing the data, Power BI provides tools such as Power Query for data cleaning and visualization panels for creating charts and dashboards.
With just a few clicks, users can build reports that show sales trends, performance metrics, and business insights.
Learning how to download and use Power BI Desktop is the first step toward developing the skills required to become a Power BI developer and work with real-world data analytics projects.
How Power BI Works
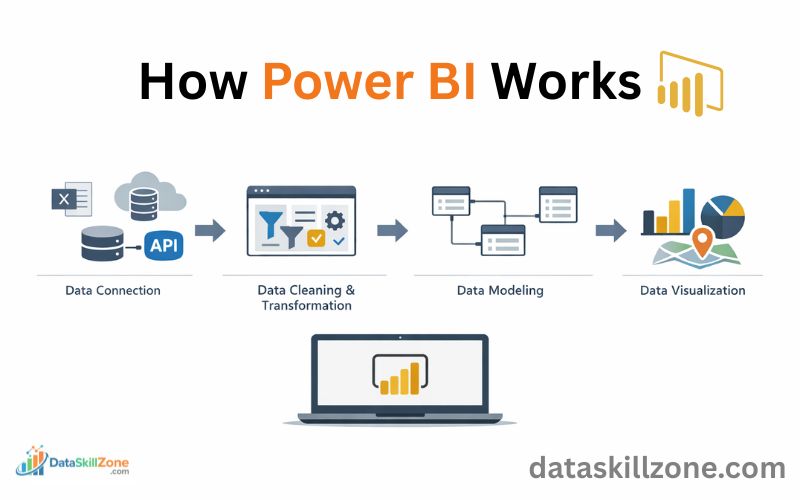
To understand the role of a Power BI Developer, it is important to understand the typical workflow used when building a Power BI report.
Data Connection
The first step is connecting Power BI to a data source.
Power BI supports many data sources, including:
- Excel files
- CSV files
- SQL Server databases
- Cloud platforms
- APIs
A Power BI Developer usually connects multiple datasets and combines them inside the tool.
Data Cleaning and Transformation
Real-world data often contains errors, missing values, and inconsistent formats.
Power BI includes a feature called Power Query, which allows developers to clean and prepare the data before analysis.
Some common tasks include:
- Removing duplicate records
- Renaming columns
- Filtering unnecessary rows
- Splitting or merging columns
This process ensures the dataset is structured properly.
Data Modeling
After cleaning the data, the next step is creating relationships between tables.
For example, a dataset may contain:
Sales table
Products table
Customer table
A Power BI Developer links these tables using common fields such as product ID or customer ID.
This relationship structure is known as the data model.
Data Visualization
The final stage is building visual reports.
Power BI offers many visualization options such as:
- Bar charts
- Line graphs
- Pie charts
- Maps
- KPI indicators
A Power BI Developer chooses the most appropriate visuals to represent the data clearly.
Power BI Dashboard Examples
Power BI dashboards are used in many departments across an organization.
These dashboards help organizations monitor performance, track key metrics, and quickly identify trends.
Sales Dashboard
A sales dashboard might show:
- Daily revenue
- Monthly sales growth
- Top-performing products
- Regional sales distribution
Sales managers use this information to track performance and adjust strategies.
Marketing Dashboard
Marketing teams use Power BI to track campaign performance.
Typical metrics include:
- Website traffic
- Conversion rates
- Cost per lead
- Campaign ROI
This helps marketing teams understand which campaigns are producing the best results.
Financial Dashboard
Finance departments rely on dashboards to monitor business health.
Typical financial dashboards include:
- Profit and loss summaries
- Expense analysis
- Revenue growth trends
- Budget comparisons
Because dashboards play such an important role in business reporting, many organizations hire skilled Power BI developers who can design dashboards that present clear and actionable insights.
Power BI vs Tableau
When discussing business intelligence tools, one of the most common comparisons is Power BI vs Tableau.
Both platforms are widely used for data visualization, dashboard creation, and analytics.
Companies use these tools to convert raw data into meaningful insights that support better decision-making.
Although both tools serve similar purposes, they differ in terms of pricing, usability, features, and integration capabilities.
Overview of Power BI
- Power BI is Microsoft’s data analysis platform that allows users to turn large amounts of raw data into easy-to-understand visual reports and dashboards.
- It is known for its user-friendly interface, strong integration with Microsoft products, and affordable pricing.
- Many organizations that already use tools like Excel, Azure, or SQL Server prefer Power BI because it fits naturally into their existing systems.
Overview of Tableau
- Tableau is a powerful data visualization tool used by analysts and organizations to explore large datasets and build interactive dashboards.
- It is especially popular for its advanced visualizations and ability to handle complex data analysis tasks.
Key Differences Between Power BI and Tableau
| Feature | Power BI | Tableau |
|---|---|---|
| Developer | Microsoft | Salesforce |
| Ease of Use | Beginner-friendly interface | Slightly steeper learning curve |
| Data Visualization | Good visualization features | Very advanced visual design |
| Pricing | Lower cost for most businesses | Higher licensing cost |
| Integration | Strong integration with Microsoft ecosystem | Works well across multiple platforms |
| Performance | Ideal for small to medium datasets | Handles very large datasets efficiently |
For example, Power BI Pro licenses are typically around $10 per user per month, while Tableau creator licenses can cost significantly more, which is why many companies choose Power BI for cost efficiency.
Which Tool Should You Choose?
The choice between Power BI and Tableau usually depends on business needs.
Power BI is often preferred when:
• Organizations use Microsoft tools like Excel and Azure
• Budget is an important factor
• Teams want a tool that is easy to learn
Tableau may be preferred when:
• Advanced visual storytelling is required
• Analysts work with very large datasets
• Organizations use a variety of non-Microsoft systems
Both tools are powerful, and many data professionals learn both during their careers.
However, because of its affordability and Microsoft integration, Power BI has become extremely popular for businesses and aspiring Power BI developers.
Power BI Pricing: Free vs Pro vs Premium
Power BI offers multiple pricing plans designed for different types of users, from individual learners to large enterprises.
Understanding these plans helps businesses choose the right option based on their data analysis needs and collaboration requirements.
The three most common Power BI plans are Free, Power BI Pro, and Power BI Premium. Each plan provides different features and capabilities.
1. Power BI Free
The Power BI Free plan is designed mainly for individual users who want to explore the tool and create dashboards for personal use.
Key features include:
• Create reports using Power BI Desktop
• Connect to multiple data sources
• Build interactive dashboards and visuals
• Analyze data locally on your computer
However, the main limitation is that users cannot easily share reports with others unless they upgrade to a paid plan.
This version is ideal for beginners learning Power BI or individuals practicing data analysis skills.
2. Power BI Pro
Power BI Pro is the most commonly used paid plan for professionals and teams.
The approximate price is $14 per user per month (around ₹1,165/month in India).
Key features include:
• Publish reports to the Power BI cloud service
• Share dashboards with team members
• Collaborate on reports across the organization
• Schedule automatic data refresh
• Access dashboards from web and mobile devices
This plan is commonly used by Power BI developers, analysts, and business teams who need to share reports internally.
3. Power BI Premium (Per User)
Power BI Premium provides advanced capabilities for organizations that work with large datasets and complex analytics.
The price is typically $24 per user per month (around ₹1,995/month).
Premium features include:
• Larger dataset capacity
• Faster performance and more frequent data refresh
• Advanced AI and machine learning capabilities
• Paginated reports and enterprise analytics features
Large enterprises can also purchase Premium Capacity, which allows organizations to run Power BI on dedicated cloud resources.
Quick Comparison
| Plan | Price | Best For |
|---|---|---|
| Free | $0 | Beginners and personal learning |
| Power BI Pro | ~$14 per user/month | Teams sharing reports |
| Power BI Premium | ~$24 per user/month | Large datasets and enterprise analytics |
For most beginners and small teams, Power BI Pro is usually the best starting point. Larger organizations that require advanced analytics and heavy workloads often choose Premium.
Use Power BI Online
Power BI can be used online through the Power BI Service, which is Microsoft’s cloud-based platform for sharing and managing reports.
While many users create dashboards using Power BI Desktop on their computers, the online version allows teams to access those reports from anywhere through a web browser.
Power BI Online is especially useful for organizations that need to share dashboards with multiple team members.
Instead of sending files manually, reports can be published to the cloud where authorized users can view them in real time.
How Power BI Online Works
The typical workflow usually looks like this:
- A developer or analyst creates reports using Power BI Desktop.
- The report is then uploaded to the cloud-based Power BI Service for sharing and access.
- Team members can log in through a browser to view and interact with the dashboards.
This approach makes collaboration much easier because everyone can access the same updated report.
Key Features of Power BI Online
Power BI Service offers several important capabilities that help teams work with data more efficiently:
• Cloud-Based Access – Users can open dashboards from any device with internet access.
• Report Sharing – Reports can be shared with colleagues or entire departments.
• Scheduled Data Refresh – Data can automatically update at regular intervals.
• Workspace Collaboration – Teams can work together on dashboards and reports.
• Security Controls – Access permissions ensure only authorized users can view sensitive data.
Benefits for Businesses
- Using Power BI online allows organizations to build a centralized reporting system where all important business metrics are stored in one place.
- Managers can quickly check performance dashboards without requesting manual reports from analysts.
- For example, a sales manager can open a dashboard from their laptop or phone and instantly review daily revenue, top-selling products, and regional sales performance.
- Because of these capabilities, many companies rely on Power BI developers to build and maintain dashboards that are published and shared through the Power BI cloud service.
How Power BI Works with Excel
Power BI and Excel are both powerful tools developed by Microsoft, and they work extremely well together in data analysis projects.
Many organizations already store large amounts of data in Excel spreadsheets, which makes it easy to import that data directly into Power BI for deeper analysis and visualization.
Instead of manually analyzing rows of numbers in Excel, users can connect their Excel files to Power BI and convert the data into interactive dashboards and visual reports.
This allows businesses to quickly identify patterns, trends, and key performance indicators.
Ways Power BI Integrates with Excel
Power BI provides several ways to connect and work with Excel data.
Several industries actively recruit professionals with Power BI expertise, including:
• Importing Excel Files – Users can directly upload Excel workbooks into Power BI Desktop and start building reports.
• Connecting to Excel Data Sources – Power BI can automatically refresh data from Excel files stored on OneDrive or SharePoint.
• Using Excel Data Models – Existing Power Pivot models created in Excel can also be used inside Power BI.
• Exporting Reports to Excel – Users can export summarized data from Power BI dashboards back into Excel for additional calculations.
Because of this seamless integration, many companies use both tools together instead of choosing one over the other.
Why Businesses Use Power BI and Excel Together
Although Excel is excellent for calculations and spreadsheet analysis, it has limitations when working with large datasets and advanced visualizations.
Power BI solves these limitations by offering powerful reporting and visualization features.
Here are some reasons why businesses combine both tools:
• Excel for data storage and calculations
• Power BI for dashboards and visual reports
• Automated data updates and refresh schedules
• Better collaboration through cloud sharing
For example, a finance team might store monthly financial data in Excel, while a Power BI developer builds a dashboard that automatically visualizes revenue, expenses, and profit trends.
This combination allows businesses to take advantage of Excel’s flexibility and Power BI’s visualization capabilities, making data analysis faster and more efficient.
Export Power BI Data To Excel
Power BI dashboards and reports allow users to export data directly to Excel, which makes it easier for teams to perform additional analysis outside the dashboard.
This feature is extremely useful for businesses that still rely on Excel for detailed calculations, reporting, or sharing data with other departments.
Even though Power BI is designed to visualize and analyze data within interactive dashboards, there are situations where users may want to download the underlying data for further examination.
Power BI provides built-in export options that make this process simple.
How to Export Power BI Data to Excel
Users can export data from a Power BI report by following a few simple steps:
- Start by opening the report or dashboard within the Power BI Service platform.
- Click on the visual (chart or table) containing the data.
- Select the More Options (three dots) menu.
- Choose Export Data.
- Download the file in Excel (.xlsx) or CSV format.
Once exported, the dataset can be opened in Excel for further analysis.
Benefits of Exporting Power BI Data to Excel
Many organizations combine the strengths of both tools. Power BI provides powerful visualization, while Excel offers flexibility for detailed calculations and manual adjustments.
Some key benefits include:
• Advanced Calculations – Users can apply Excel formulas and additional analysis.
• Data Sharing – Teams can easily share exported Excel files with colleagues.
• Offline Access – Data can be reviewed without opening Power BI.
• Custom Reporting – Users can build their own pivot tables or charts in Excel.
When Businesses Use This Feature
For example, a sales manager might view a dashboard showing monthly revenue in Power BI. If they want to analyze individual transaction details, they can export the data to Excel and perform deeper analysis such as pivot tables or forecasting.
This flexibility allows organizations to combine Power BI visualization capabilities with Excel’s analytical tools, creating a more complete data analysis workflow.
Because of this integration, many companies rely on skilled Power BI developers who understand how to design dashboards that allow users to explore insights while still having the option to export data when needed.
Why Power BI Instead of Excel
Excel has been a popular tool for data analysis for many years.
It works well for calculations, small datasets, and simple reports. However, as businesses started handling larger and more complex datasets, many organizations began using Power BI for advanced data analysis.
Power BI is designed specifically for business intelligence and data visualization, which makes it more suitable for modern data-driven organizations.
Limitations of Excel
While Excel is powerful, it can become difficult to manage when datasets grow larger or when multiple teams need access to the same information. Some common limitations include:
• Large Excel files may slow down performance
• Managing multiple spreadsheets becomes complicated
• Reports often require manual updates
• Limited interactive visualization features
Because of these challenges, businesses often look for tools that can handle data more efficiently.
Advantages of Power BI
Power BI provides several features that make data analysis faster and more efficient:
• Dashboards with interactive features that let users drill down and examine data in detail.
• Ability to handle large datasets more efficiently
• Automatic data refresh, reducing manual work
• Cloud-based sharing, allowing teams to access dashboards anywhere
• Advanced data modeling and visualization tools
How Power BI Connects to SQL Server
A Power BI developer should also understand SQL for data analysis techniques because many organizations store their data inside relational databases.
Connecting Power BI to SQL Server
Power BI Desktop provides a built-in connector that allows users to easily connect to SQL Server databases. The typical process involves a few simple steps:
- Open Power BI Desktop.
- Click Get Data from the Home menu.
- Select SQL Server Database from the list of available sources.
- Enter the server name and database details.
- Import the data or connect using DirectQuery mode.
Once the connection is established, users can begin transforming and analyzing the data inside Power BI.
Other Data Sources Supported by Power BI
In addition to SQL Server, Power BI supports connections with many other data sources, including:
• Excel and CSV files
• MySQL and PostgreSQL databases
• Cloud-based platforms, including Microsoft Azure, Google Analytics, and Salesforce.
• Web APIs and online datasets
Why This Matters for Businesses
For example, a retail company may store sales data inside a SQL Server database. A Power BI developer can connect the database directly to a dashboard that automatically updates daily sales performance, inventory levels, and revenue trends.
This connection allows analysts to work with large datasets and generate insights directly from enterprise databases.
How Power BI Dashboards Works
Unlike traditional reports that contain static tables and numbers, Power BI dashboards present information using charts, graphs, maps, and other visual elements.
These visuals allow users to understand complex data at a glance.
How Power BI Dashboards Are Created
Power BI dashboards are usually created through a simple process:
- Connect Data Sources – Data is imported from sources such as Excel files, SQL databases, or cloud services.
- Transform the Data – Power Query helps clean, organize, and prepare the dataset before analysis.
- Build Visualizations – Charts, tables, and graphs are added to create a report.
- Publish to Power BI Service – The report is uploaded to the cloud where dashboards can be created and shared.
Once published, users can access dashboards through a web browser or mobile application.
Key Features of Power BI Dashboards
Power BI dashboards provide several features that make them useful for businesses:
• Interactive visuals that allow users to filter and explore data
• Real-time updates when connected to live data sources
• Drill-down capabilities to view detailed information
• Cloud sharing, allowing teams to access reports anywhere
Skills Required to Become a Power BI Developer
To become a successful Power BI Developer, several technical skills are important.
Technical Skills
A Power BI developer should have strong knowledge of the following technical areas:
• Power BI Desktop – Understanding how to create dashboards, reports, and visualizations.
• Power Query – Used for cleaning, transforming, and preparing data before analysis.
• DAX (Data Analysis Expressions) – A formula language used for calculations and advanced analytics.
• Data Modeling – Creating relationships between different datasets for efficient reporting.
• SQL Basics – Writing queries to retrieve data from databases such as SQL Server.
Data Visualization Skills
Apart from technical knowledge, developers should also understand how to present data effectively. Important skills include:
• Designing clear and easy-to-understand dashboards
• Choosing the right charts for different types of data
• Highlighting key business insights through visuals
Business Understanding
A good Power BI developer also needs basic knowledge of business processes. This helps them understand what kind of reports managers and stakeholders need.
For example, sales teams may need dashboards showing revenue trends, product performance, and regional sales comparisons.
By combining technical expertise with strong analytical thinking, a Power BI developer can build dashboards that help organizations make better data-driven decisions.
Power BI Entry Level Jobs
Learning Power BI can lead to several entry-level roles in data analytics.
Many beginners start their careers by applying for entry level data analyst jobs, where they gain hands-on experience with tools like Excel, SQL, and Power BI.
Common Entry-Level Power BI Jobs
Some of the most common entry-level positions include:
• Junior Power BI Developer – Assists in building reports, dashboards, and visualizations.
• Data Analyst – Analyzes datasets and creates insights using tools like Power BI and Excel.
• Business Intelligence Analyst – Helps organizations track performance through data reporting.
• Reporting Analyst – Builds automated reports and monitors business metrics.
These roles usually involve tasks such as cleaning data, creating visual reports, and helping senior analysts maintain dashboards.
Before applying for jobs, it’s important to prepare a strong ATS-friendly data analyst resume that highlights your technical skills and project experience.
Skills Employers Look For
For entry-level Power BI positions, employers often expect candidates to have basic knowledge of:
• Power BI Desktop
• Data visualization principles
• Excel and SQL fundamentals
• Basic data analysis skills
Many professionals start in these roles and gradually grow into more advanced positions such as Power BI developer or data analyst.
Are Power BI Developers in Demand?
One of the most common questions people ask before learning a new skill is whether it will actually help them find job opportunities.
When it comes to data analytics and business intelligence, the answer is clear – Power BI developers are in high demand across many industries.
In recent years, companies have started relying heavily on data to guide their strategies and operations. Businesses collect large amounts of information from sales systems, marketing platforms, customer databases, and online applications.
However, raw data alone does not provide value unless it is properly analyzed and visualized.
At this point, the expertise of a Power BI developer is crucial for transforming data into actionable insights.
Power BI developers help organizations transform complex datasets into clear dashboards and reports. These dashboards allow managers and executives to track important metrics such as revenue growth, customer trends, and operational performance.
Industries Hiring Power BI Developers
The demand for Power BI developers is growing in many industries because almost every organization needs data insights.
Many industries are actively recruiting professionals with Power BI expertise, including:
• Retail and e-commerce companies
• Banking and financial institutions
• Healthcare organizations
• Marketing and advertising agencies
• Technology and consulting firms
Even small and medium-sized businesses are adopting business intelligence tools to stay competitive.
Why the Demand is Increasing
Several factors have contributed to the growing demand for Power BI developers:
• Rapid growth of business data
• Need for real-time decision making
• Increase in data-driven business strategies
• Popularity of Microsoft Power BI as a BI tool
Because Power BI integrates easily with tools like Excel, SQL Server, and cloud platforms, many companies prefer it over other analytics solutions.
Career Opportunities
Professionals with Power BI skills can work in roles such as:
• Power BI Developer
• Data Analyst
• Business Intelligence Analyst
• Data Visualization Specialist
As organizations continue to invest in analytics and reporting tools, the demand for skilled Power BI developers is expected to remain strong for many years.
As professionals gain experience, roles like Power BI developer can grow into high-paying remote data careers that offer strong salaries and flexible work opportunities.
Best Power BI Courses for Beginners
A good Power BI course should teach not only the basics of the software but also practical skills such as data modeling, dashboard creation, and DAX calculations.
Courses that include hands-on projects and real datasets are usually the most effective for building practical experience.
Recommended Power BI Courses for Beginners
Here are some of the most popular Power BI courses that beginners often choose:
1. Microsoft Learn – Power BI Learning Path
2. Coursera – Microsoft Power BI Complete Masterclass
3. Udemy – Microsoft Power BI Beginner to Advanced Course
4. LinkedIn Learning – Power BI Essential Training
How to Choose the Right Course
When selecting a course, beginners should consider the following factors:
• Course level (beginner-friendly)
• Hands-on projects and assignments
• Coverage of Power Query and DAX
• Certification or completion certificate
• Instructor experience and student reviews
Most beginners can learn the basics of Power BI within 4-8 weeks if they practice regularly and work on small data projects.
Final Thoughts
Power BI has become one of the most powerful tools for modern data analysis.
It allows organizations to transform raw datasets into meaningful visual insights that guide business decisions.
For individuals interested in building a career in analytics, learning Power BI and developing the skills required for a Power BI Developer role can open many opportunities.
With practice, real-world projects, and continuous learning, anyone can build strong Power BI skills and grow in the field of data analytics.
FAQs
Yes, the demand for Power BI developers continues to grow as companies rely more on data to make decisions. Many industries such as finance, healthcare, retail, and e-commerce are actively hiring professionals who can build dashboards and analyze business data using Power BI.
Common Power BI dashboard examples include:
- Sales performance dashboards
- Marketing campaign dashboards
- Financial analysis dashboards
- Inventory and supply chain dashboards
- Customer behavior analytics dashboards
These dashboards allow managers to monitor performance and quickly identify trends.
Power BI Pro is the paid version of Power BI that allows users to share dashboards, collaborate with teams, and publish reports securely in the cloud. The free version is suitable for personal use, while Power BI Pro is designed for organizations that need collaboration and report sharing features.
To become a successful Power BI developer, professionals usually learn:
Basic knowledge of data modeling
Data visualization and dashboard design
SQL for database queries
Power Query for data transformation
DAX formulas for advanced calculations
Beginners with basic Excel knowledge can start building simple dashboards within a few weeks. However, mastering advanced concepts like data modeling, DAX formulas, and dashboard optimization may take around 3 to 6 months of consistent practice.
Power BI does not require heavy programming skills. Most tasks such as creating Power BI dashboard examples and building reports can be done using a graphical interface. However, learning DAX (Data Analysis Expressions) and basic SQL can help Power BI developers create more advanced data models and calculations.
Yes, Power BI is designed to work with large datasets. When connected to databases like SQL Server or cloud platforms, Power BI can analyze millions of rows of data efficiently.
DAX (Data Analysis Expressions) is a formula language used in Power BI to perform advanced calculations.
Yes, earning a Microsoft Power BI certification can improve your chances of getting hired as a Power BI developer or data analyst.
Yes, Power BI can connect to many data sources including SQL Server databases, Excel files, cloud platforms, and APIs.
1 Comment