
Introduction
In today’s digital world, almost every business relies on data to make decisions.
Companies track sales numbers, customer behavior, marketing campaigns, financial performance, and operational activities using data.
However, simply collecting data is not enough. Businesses need professionals who can analyze data and turn it into useful insights.
This is where data analysis becomes important.
Because of its versatility and ease of use, learning Excel skills for data analysis has become one of the most important starting points for anyone entering the data analytics field.
Among all the tools used in analytics today, Microsoft Excel remains one of the most widely used tools for data analysis.
Even though modern technologies like Python, SQL, Tableau, and Power BI are growing rapidly, Excel continues to play a major role in the daily workflow of analysts.
One of the biggest reasons for Excel’s popularity is its simplicity and accessibility.
Almost every company uses Microsoft Office, which means Excel is already available on most computers. This makes it easy for teams to share spreadsheets, collaborate on reports, and quickly analyze business data.
For beginners entering the data field, learning Excel skills for data analysis is often the first practical step toward becoming a data analyst or MIS professional.
There are several entry-level career opportunities where strong spreadsheet skills are highly valuable. If you are planning to start your career using Excel, you can explore 10 powerful Excel jobs for freshers that can start your career, which explains different roles where Excel knowledge can help you enter the data field.
Excel provides a comfortable environment where users can organize data, perform calculations, create charts, and generate reports without needing programming knowledge.
In real business environments, Excel is used for many tasks such as:
- Tracking sales performance 📈
- Preparing monthly MIS reports 📊
- Managing inventory data 📦
- Analyzing marketing campaign results 📣
- Building financial models 💰
- Creating dashboards for management 📉
For example, a retail company might collect daily sales data from multiple stores.
An analyst can import this data into Excel, clean the dataset, summarize results using pivot tables, and create charts to visualize performance.
Because of its flexibility, Excel is often the first tool used to explore and understand data before moving to advanced analytics tools.
In this complete guide, we will explore the most important Excel skills for data analysis that every aspiring data analyst, MIS executive, or business professional should learn.
If you want to work in analytics, mastering these Excel skills can significantly improve your ability to work with data effectively.
Why Excel Is Still Important for Data Analysis 💡
With the rise of advanced analytics platforms, some people believe Excel is becoming outdated.
However, this assumption is far from reality. In fact, Excel continues to be one of the most widely used tools in business data analysis.
One of the main reasons is that Excel provides a simple and flexible environment to explore datasets quickly.
When analysts receive raw data from systems like CRM software, accounting systems, or databases, the first step is often to open the data in Excel.
This allows them to:
- Understand the dataset structure
- Identify errors or missing values
- Perform quick calculations
- Explore patterns in the data
Excel is also extremely useful for small to medium-sized datasets, which represent a large portion of everyday business data.
Many operational reports such as:
- Daily sales summaries
- Expense reports
- Inventory tracking
can easily be handled using Excel.
Another important advantage of Excel is its ease of use.
Unlike programming tools, Excel does not require coding knowledge. Users can perform complex analysis using built-in features like
- Formulas
- Filters
- Pivot tables
Excel is also highly flexible. Users can quickly modify datasets, apply formulas, and generate visual reports without needing specialized software.
In many organizations, Excel is used for tasks such as:
- Sales performance analysis 📊
- Financial forecasting 💰
- Marketing data analysis 📣
- Supply chain reporting 📦
- Business dashboards 📈
For example, a marketing team might track campaign performance in Excel to measure metrics like impressions, clicks, and conversions.
By analyzing this data, they can identify which campaigns are performing well and which ones need improvement.
Because of these capabilities, Excel continues to remain a core skill for anyone working in data analysis.
This is why many professionals still consider Excel skills for data analysis to be a fundamental requirement for working with business data.
Basic Excel Skills for Data Analysis Every Analyst Should Know
Before learning advanced analytics techniques, every data analyst must first build a strong foundation in basic Excel skills.
These skills are used almost every day when preparing data for analysis. Even experienced analysts rely on these fundamental operations to organize and clean datasets.
Learning these basic Excel skills will help you work faster and avoid common mistakes when dealing with business data.
Data Cleaning in Excel 🧹
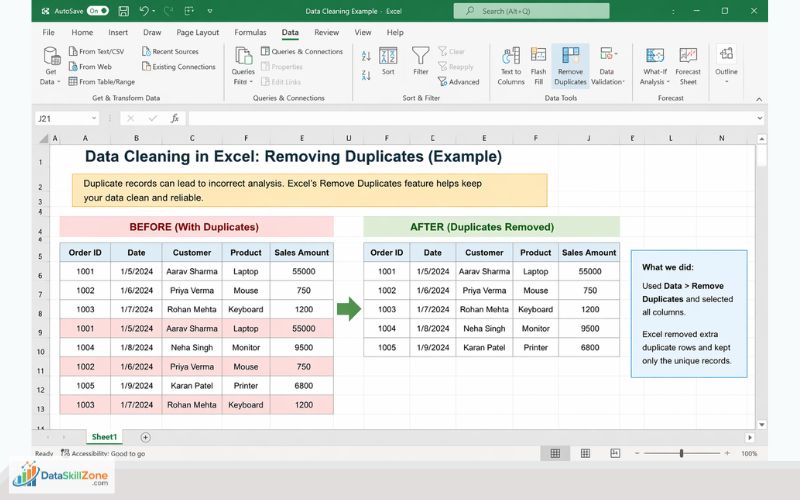
In real-world situations, datasets are rarely perfect.
Data collected from different sources often contains errors or inconsistencies. For example, a dataset might contain duplicate records, incorrect formatting, or missing values.
If these problems are not fixed before analysis, they can lead to incorrect insights and misleading conclusions.
This is why data cleaning is one of the most important Excel skills for data analysis, especially for beginners who want to work with business datasets effectively.
In fact, many experienced analysts believe that strong Excel skills for data analysis begin with the ability to clean and structure messy datasets correctly.
Excel provides several built-in tools that help analysts clean data efficiently.
Some common data cleaning tasks include:
- Removing duplicate records
- Fixing inconsistent date formats
- Correcting spelling errors in text fields
- Filling missing values
- Removing unnecessary spaces in text
For example, a sales dataset may contain multiple entries for the same transaction due to system errors. Using Excel’s Remove Duplicates feature, analysts can quickly eliminate duplicate records.
Another common issue is extra spaces in text fields. Excel functions like the TRIM function in Excel help remove unnecessary spaces so that the data becomes consistent.
Clean data is essential because accurate analysis always begins with well-structured datasets.
Clean datasets also make it easier to build accurate MIS reports in Excel, which are commonly used by businesses to monitor performance.
Sorting and Filtering Data 🔎
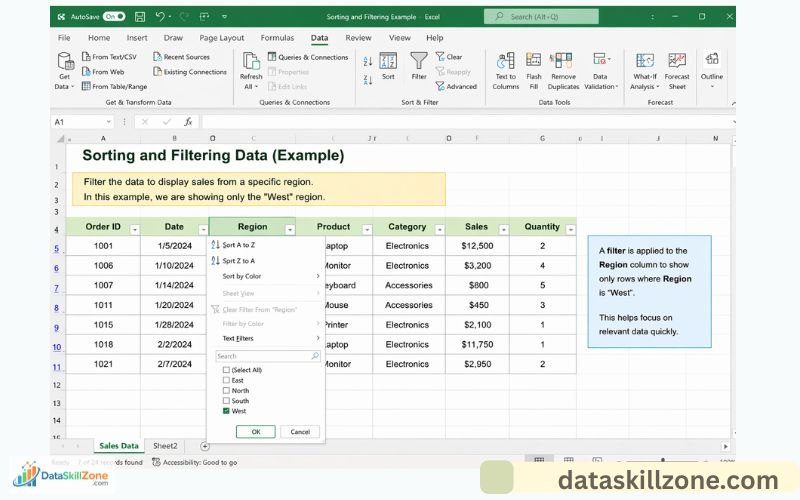
Sorting and filtering are simple but powerful Excel features that help analysts explore datasets efficiently.
Sorting arranges data in a specific order. Analysts often sort data to quickly identify patterns or extreme values.
For example, sorting a dataset by highest sales value can help identify the best-performing products.
Sorting can be applied to different types of data:
- Numbers
- Dates
- Alphabetical text
Filtering works slightly differently. Instead of rearranging data, filtering allows users to display only specific rows that match certain conditions.
For example, analysts might filter a dataset to show:
- Sales from a particular region
- Orders placed within a certain date range
- Products belonging to a specific category
Filtering is especially helpful when working with large datasets because it allows analysts to focus only on relevant information.
Important Excel Formulas for Data Analysis 🧮
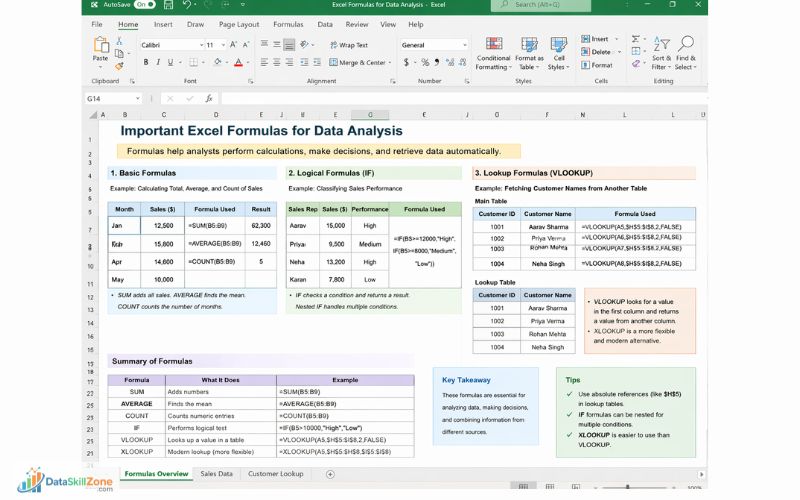
Formulas are one of the most powerful features of Excel.
They allow analysts to perform calculations automatically and transform raw data into meaningful insights.
Many everyday analytical tasks rely heavily on Excel formulas.
Some of the most commonly used formulas include:
Basic formulas
These formulas perform simple calculations.
- SUM – Adds numbers in a range
- AVERAGE – Calculates the mean value
- COUNT – Counts numeric entries
Example use case: Calculating total monthly sales.
Logical formulas
Logical formulas help analysts perform conditional calculations.
One of the most widely used logical formulas is the IF function.
Example:
An analyst can classify sales performance as:
- High
- Medium
- Low
based on revenue thresholds.
Lookup formulas
Lookup formulas allow analysts to retrieve data from other tables.
Examples include:
- VLOOKUP
- XLOOKUP
These formulas are commonly used when working with multiple datasets.
For example, an analyst may use VLOOKUP to fetch customer names based on customer IDs stored in another spreadsheet.
Understanding formulas is a key part of developing strong Excel skills for data analysis, because most analytical tasks rely on accurate calculations.
Advanced Excel Skills for Data Analysis Used by Professionals ⚡
Once the fundamentals are clear, analysts can begin learning more advanced Excel tools. These features allow users to analyze larger datasets and generate deeper insights.
Advanced Excel skills are often required in professional data analyst roles.
Pivot Tables 📊
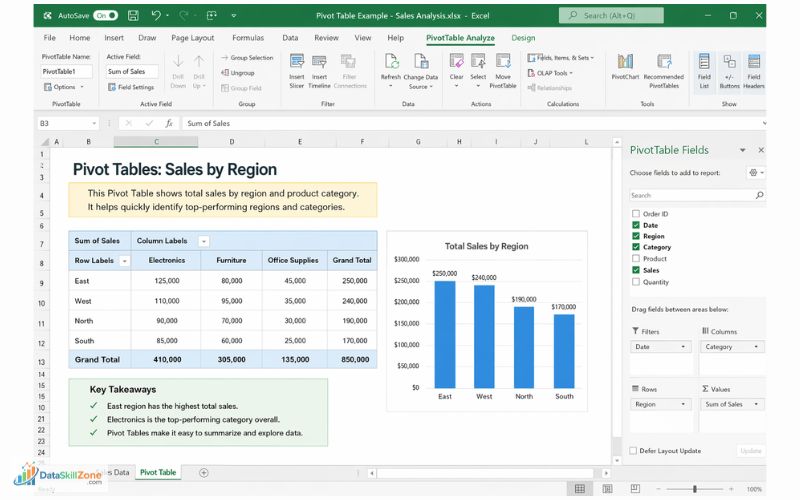
Pivot Tables are one of the most powerful tools available in Excel for data analysis.
They allow analysts to summarize large datasets quickly without writing complex formulas.
A Pivot Table organizes data into four main areas:
- Rows
- Columns
- Values
- Filters
This structure makes it easy to calculate totals, averages, counts, and percentages for different categories.
For example, a Pivot Table can quickly answer questions such as:
- What are total sales by region?
- Which product category generated the highest revenue?
- What are monthly sales trends?
Another major advantage of Pivot Tables is flexibility. Analysts can easily rearrange fields to explore the dataset from different perspectives.
Pivot tables are one of the most valuable Excel skills for data analysis because they allow analysts to summarize thousands of rows of data quickly.
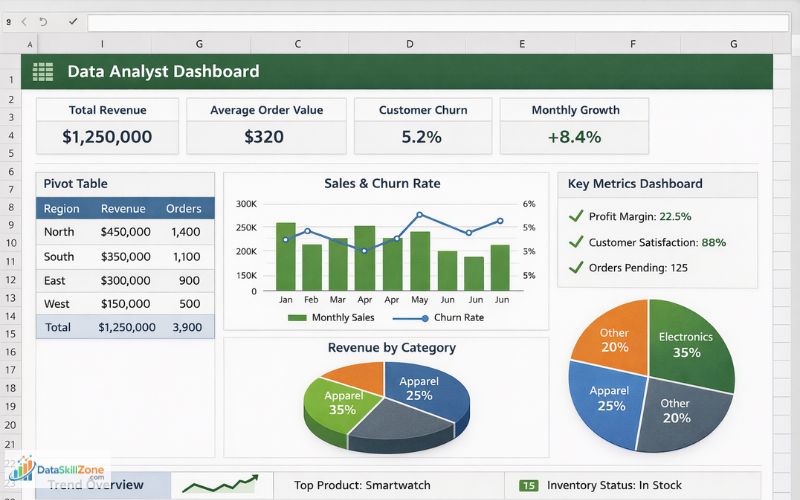
Data Visualization in Excel 📈
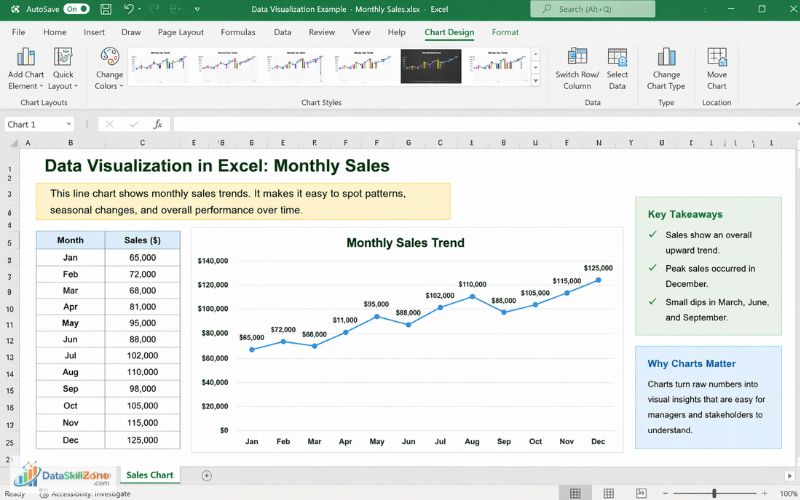
Numbers alone can sometimes be difficult to interpret.
Data visualization is another important part of Excel skills for data analysis, especially when presenting insights to business managers.
Data visualization helps transform raw numbers into clear visual patterns.
Excel offers several chart types that help communicate insights effectively.
Common Excel charts include:
- Bar charts
- Line charts
- Pie charts
- Column charts
These charts allow analysts to present information in a way that is easier for managers and stakeholders to understand.
For example:
- A line chart can show sales trends over time.
- A bar chart can compare product performance across regions.
Well-designed charts help turn complex data into clear business insights.
Power Query for Data Transformation 🔄
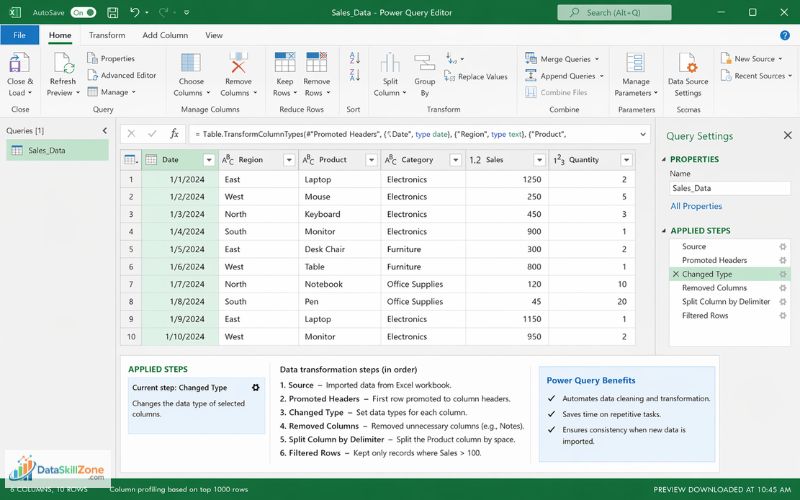
Power Query is one of the most advanced features available in modern versions of Excel.
It allows analysts to import, clean, and transform data automatically.
Instead of repeating the same data cleaning steps every time new data arrives, Power Query records the transformation process and applies it automatically.
This feature saves significant time when working with large datasets.
Power Query can perform operations such as:
- Removing unnecessary columns
- Splitting text values
- Filtering records
- Merging datasets
- Changing data formats
Because of its automation capabilities, Power Query is becoming an essential tool for professional data analysts.
Common Excel Mistakes Beginners Make in Data Analysis ⚠️
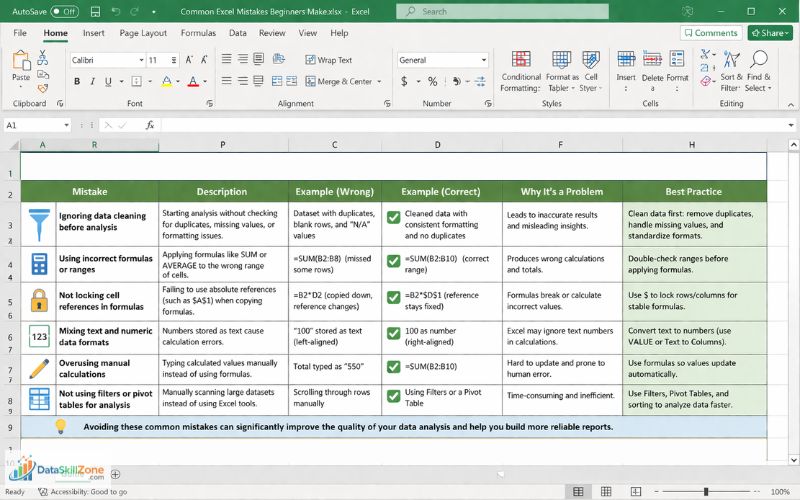
When beginners start working with datasets in Excel, it is common to make small mistakes that can affect the accuracy of analysis. These errors usually happen because users focus only on calculations and overlook important steps like data cleaning, formatting, or validation.
Even simple mistakes can lead to incorrect reports or misleading insights. Understanding these common issues can help beginners build better habits and improve their overall Excel skills for data analysis.
Some of the most common mistakes include:
- Ignoring data cleaning before analysis
Many beginners immediately start building formulas or charts without checking the dataset for duplicates, missing values, or formatting problems. - Using incorrect formulas or ranges
Sometimes formulas like SUM or AVERAGE are applied to the wrong range of cells, which produces inaccurate calculations. - Not locking cell references in formulas
When copying formulas across cells, failing to use absolute references (such as $A$1) can cause formulas to break or calculate incorrect values. - Mixing text and numeric data formats
Numbers stored as text can cause problems when performing calculations, leading to errors or incorrect totals. - Overusing manual calculations instead of formulas
Beginners sometimes type calculated values manually instead of using Excel formulas, which makes the dataset harder to update and maintain. - Not using filters or pivot tables for analysis
Instead of manually scanning large datasets, Excel tools like filters and pivot tables can help analyze data more efficiently.
Avoiding these common mistakes can significantly improve the quality of your data analysis and help you build more reliable reports.
If you want to explore more practical examples and learn how to avoid common spreadsheet errors, you can also read our detailed guide on common Excel mistakes beginners make, which explains how to identify and fix these issues step by step.
Important Excel Skills for Data Analyst Jobs 💼
Excel is one of the most commonly requested skills in data analyst job descriptions.
Employers expect analysts to know how to work with business data efficiently using spreadsheets.
Some typical Excel tasks performed by data analysts include:
- Cleaning datasets before analysis
- Performing calculations using formulas
- Creating pivot tables for summary reports
- Building charts to visualize trends
- Preparing dashboards for management
Strong Excel skills demonstrate that a candidate can analyze data and generate insights effectively.
If you are planning to start a career in analytics, understanding these practical Excel skills can also help when preparing a data analyst resume and showcasing real data handling experience.
How to Practice Excel Skills for Data Analysis (Real Practice Methods)
Learning Excel concepts is helpful, but real improvement happens when you start working with actual datasets. Practicing with real data allows you to understand how Excel tools like formulas, filters, and pivot tables are used in real business situations.
Many data analysts improve their skills by regularly solving small data problems, analyzing datasets, and building simple reports in Excel.
In real business environments, analysts often convert raw datasets into structured reports for management. In fact, in one of our detailed guides, I explain how I convert raw data into professional MIS reports using Excel with real practical examples, which demonstrates how raw business data can be transformed into meaningful reports.
Over time, this hands-on practice helps develop stronger analytical thinking and confidence when working with business data.
Here are some simple ways to practice Excel for data analysis:
- Work with sample sales or financial datasets and try analyzing trends
- Practice using formulas like SUM, IF, and VLOOKUP on real data
- Build pivot tables to summarize large datasets
- Create charts and dashboards to visualize insights
- Try cleaning messy datasets by removing duplicates and fixing formats
Practicing with real datasets is one of the most effective ways to strengthen your Excel skills for data analysis and improve analytical thinking.
Consistent practice with these methods helps build practical experience and prepares you for real-world data analysis tasks.
Expanding Your Data Analysis Skills Beyond Excel 🚀
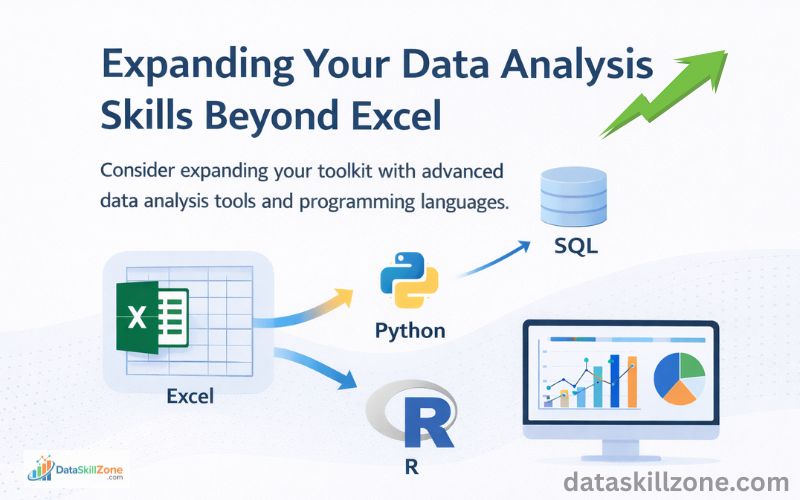
Modern businesses often combine spreadsheet analysis with advanced tools that help process larger datasets and create interactive dashboards.
For example, organizations like IBM provide educational resources that explain the fundamentals of data analytics, including how analysts clean, prepare, and interpret business data before making decisions.
Similarly, Microsoft’s Power BI platform for data visualization allows analysts to transform raw data into interactive dashboards that help management understand business performance more clearly.
Beginners who want to grow in the analytics field can also explore data analytics fundamentals and best practices provided by Google Cloud, which explain how companies manage and analyze large volumes of data.
Additionally, educational platforms like Coursera offer practical learning resources about modern data analysis techniques and tools, helping learners understand how Excel skills connect with advanced analytics technologies.
By exploring these resources, aspiring analysts can better understand how Excel fits into the larger data analytics ecosystem used in modern organizations.
Who Should Learn Excel for Data Analysis?
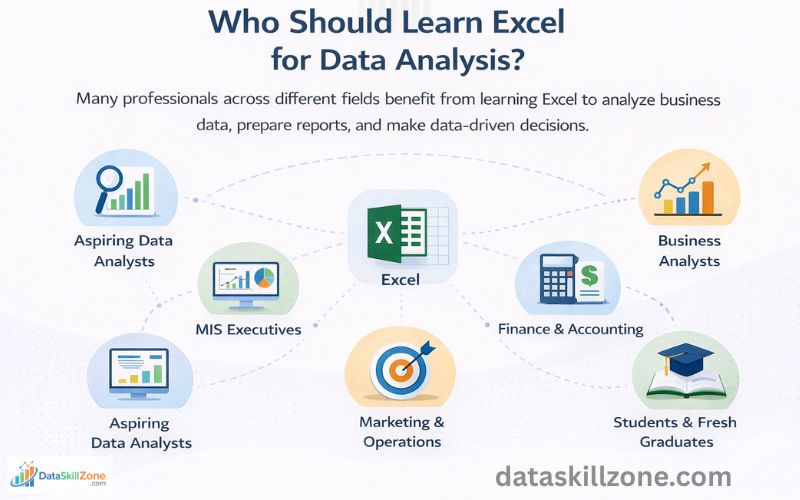
Learning Excel skills for data analysis can help individuals understand datasets more clearly and make better data-driven decisions. Because Excel is simple to use and widely available in most organizations, it has become an essential skill for anyone who works with numbers, reports, or business data.
Below are some professionals who can benefit greatly from learning Excel for data analysis.
Aspiring Data Analysts
For individuals who want to start a career in analytics, Excel is usually the first tool used to learn data analysis concepts. It helps beginners understand how data is structured and how insights can be extracted from datasets.
Some common tasks aspiring analysts practice in Excel include:
- Cleaning messy datasets
- Applying formulas for calculations
- Creating pivot tables for summarizing data
- Building charts to visualize trends
Developing strong Excel skills for data analysis makes it easier to transition later to advanced tools such as SQL, Python, Tableau, or Power BI.
MIS Executives
MIS (Management Information Systems) executives rely heavily on Excel for daily reporting tasks. Their main responsibility is to collect and organize data from multiple departments and convert it into structured reports for management.
Typical MIS reporting tasks in Excel include:
- Consolidating sales data from multiple branches
- Preparing daily, weekly, and monthly MIS reports
- Tracking performance metrics
- Creating dashboards for management review
Strong Excel skills allow MIS professionals to prepare accurate and well-structured business reports.
Business Analysts
Business analysts frequently work with operational data such as sales performance, customer behavior, and financial metrics. Excel helps them organize datasets and identify patterns that support business decisions.
Using Excel for analysis allows business analysts to:
- Compare performance across different time periods
- Identify trends in sales or customer data
- Generate reports that support strategic planning
With strong Excel skills for data analysis, business analysts can quickly explore datasets and communicate insights effectively.
Finance and Accounting Professionals
Finance teams use Excel extensively for financial analysis and reporting. From budgeting to forecasting, spreadsheets play a central role in financial decision-making.
Common finance-related Excel tasks include:
- Budget planning and expense tracking
- Financial forecasting and analysis
- Profit and loss reporting
- Investment and cost analysis
Because financial data often involves large calculations, Excel helps professionals perform accurate analysis and maintain well-structured financial records.
Marketing and Operations Professionals
Marketing and operations teams also rely on data to measure performance and improve business strategies. Excel provides a convenient way to organize large datasets and analyze performance metrics.
For example:
Marketing professionals may use Excel to:
- Track marketing campaign performance
- Analyze website traffic and conversions
- Compare advertising results across platforms
Operations teams may use Excel to:
- Monitor inventory levels
- Track supply chain performance
- Analyze operational efficiency
Excel helps these teams turn raw operational data into useful insights.
Students and Fresh Graduates
Students who are entering fields such as business analytics, finance, or management can gain a major advantage by learning Excel early. Many entry-level roles expect candidates to have at least basic spreadsheet and reporting skills.
Practicing Excel skills for data analysis allows students to:
- Work with real datasets
- Understand data analysis concepts
- Build practical projects for their resumes
This practical experience can significantly improve their chances of getting entry-level roles in data-related fields.
Overall, Excel remains a powerful and accessible tool for professionals across many industries. Whether you are starting your career or already working in a data-driven role, developing Excel skills for data analysis can significantly improve your ability to work with business data and generate meaningful insights.
Key Excel Skills for Data Analysis (Quick Overview)
Many beginners feel overwhelmed when learning Excel because there are many features available. However, most data analysis tasks rely on a core set of Excel skills.
Here is a quick summary of the most important Excel skills for data analysis discussed in this guide.
Data preparation skills
- Cleaning messy datasets
- Removing duplicates
- Fixing formatting issues
- Handling missing values
Core analytical skills
- Using formulas like SUM, AVERAGE, and IF
- Applying sorting and filtering
- Performing calculations across datasets
Advanced analysis tools
- Creating pivot tables
- Building charts for data visualization
- Transforming data using Power Query
These skills form the foundation of Excel-based data analysis and are widely used by professionals in business, finance, marketing, and operations.
Conclusion 🎯
Excel continues to remain one of the most powerful and widely used tools for data analysis. Despite the rise of modern analytics technologies, Excel still plays a crucial role in everyday business workflows.
By mastering important Excel skills such as data cleaning, formulas, pivot tables, and data visualization, professionals can significantly improve their ability to analyze information and generate meaningful insights.
For beginners who want to enter the world of data analytics, Excel provides an excellent starting point. It helps develop analytical thinking while allowing users to work directly with real business data.
Building strong Excel skills for data analysis is one of the best ways to start developing practical data analysis abilities.
With consistent practice and hands-on projects, Excel can become a powerful tool that helps transform raw datasets into valuable business insights.
FAQs
The most important Excel skills for data analysis include data cleaning, sorting and filtering datasets, using formulas like SUM and IF, working with lookup functions such as VLOOKUP or XLOOKUP, creating pivot tables, and building charts for data visualization. These skills help analysts transform raw business data into meaningful insights.
Excel is one of the best tools to start learning data analysis because it helps beginners understand how to clean, organize, and analyze data. However, professional analysts often combine Excel skills for data analysis with other tools such as SQL, Python, Power BI, or Tableau when working with larger datasets.
Yes, Excel is still widely used in many companies for daily business analysis. Data analysts often use Excel to clean datasets, create reports, build pivot tables, and generate charts before moving the data to advanced tools for deeper analysis.
Learning basic Excel skills for data analysis usually takes a few weeks of consistent practice. However, mastering advanced features such as pivot tables, Power Query, dashboards, and data modeling may take several months of hands-on experience with real datasets.
Excel is mainly used for spreadsheet-based calculations, reporting, and data organization. Power BI is a specialized business intelligence tool designed for creating interactive dashboards and analyzing large datasets. Many professionals use Excel for data preparation and Power BI for advanced visualization.
Some of the most useful Excel formulas for analysts include SUM, AVERAGE, COUNT, IF, VLOOKUP, XLOOKUP, INDEX, and MATCH. These formulas allow analysts to perform calculations, categorize data, and retrieve information from different datasets efficiently.
Pivot tables are one of the most powerful tools in Excel because they allow analysts to summarize large datasets quickly. By organizing data into rows, columns, values, and filters, pivot tables help identify trends, patterns, and key insights from business data.
Beginners can practice Excel skills for data analysis by working with sample datasets such as sales reports, financial data, or marketing performance data. Practicing tasks like data cleaning, building pivot tables, creating charts, and analyzing trends helps develop real-world analytical skills.